


The XRP price is making an effort to break out above $0.600. While there are positive indicators, a weekly close above $0.600 is essential for a potential upward movement.
- The XRP price has begun to rise again, approaching the $0.6050 area.
- The price is currently above $0.5880 and surpasses the 100-hourly Simple Moving Average.
- A significant bearish trend line has been broken, with resistance at $0.590 on the hourly chart of the XRP/USD pair (data source from Kraken).
- The pair could gather bullish momentum if it surpasses the resistance levels at $0.5950 and $0.600.
XRP Price May Experience Bullish Momentum
The XRP price has stayed well above $0.5750 and initiated a new increase, similar to Bitcoin and Ethereum. The price has successfully overcome the resistance levels at $0.580 and $0.5880.
A break above a significant bearish trend line with resistance at $0.590 was observed on the hourly chart for the XRP/USD pair. Buyers managed to push the price towards the 50% Fibonacci retracement of the decline from the $0.6123 high to the $0.5784 low, landing at $0.5950.
Currently, the price is above $0.5880 and the 100-hourly Simple Moving Average. However, it may encounter resistance around the $0.5950 mark.
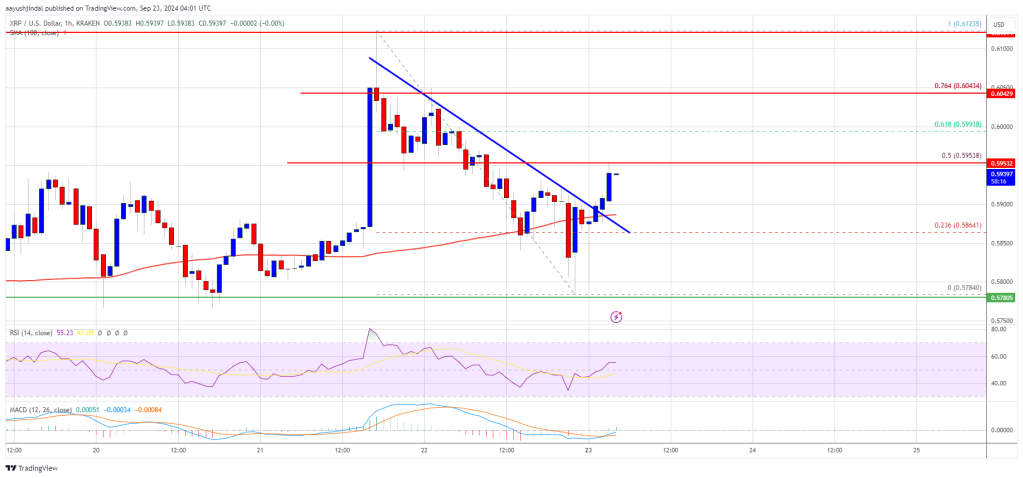
The first significant resistance is at the $0.600 level. The next important resistance might be at $0.6050, or potentially at the 76.4% Fibonacci retracement level of the drop from the $0.6123 swing high to the $0.5784 low. A decisive move over the $0.6050 level could propel the price towards the $0.6120 resistance. Further gains may push the price to the $0.6280 resistance or even $0.6320 in the near future.
Potential Rejection and Decline?
Should XRP fail to break through the $0.600 resistance area, it might initiate another decline. Initial downside support is located near the $0.5880 level and the 100-hourly Simple Moving Average. The next critical support level is around $0.580.
If a downward break occurs and a close below the $0.580 level is established, the price may continue to fall towards the $0.5720 support soon. The next vital support level stands at $0.5650.
Technical Indicators
Hourly MACD – The MACD for XRP/USD is currently accelerating in the bullish zone.
Hourly RSI (Relative Strength Index) – The RSI for XRP/USD is presently above the 50 level.
Major Support Levels – $0.5880 and $0.5720.
Major Resistance Levels – $0.5950 and $0.6050.


 Dutch
Dutch English
 French
 German
 Greek
Greek Italian
 Portuguese
 Russian
 Spanish