


As we approach the end of 2024, Bitcoin investors are closely watching the final quarter of the year, which is typically associated with positive price movements. Many believe a bullish rally could be imminent, so let’s explore the historical data, examine trends, and consider the potential scenarios for BTC’s price action as the year wraps up.
Bitcoin’s Historical Q4 Performance
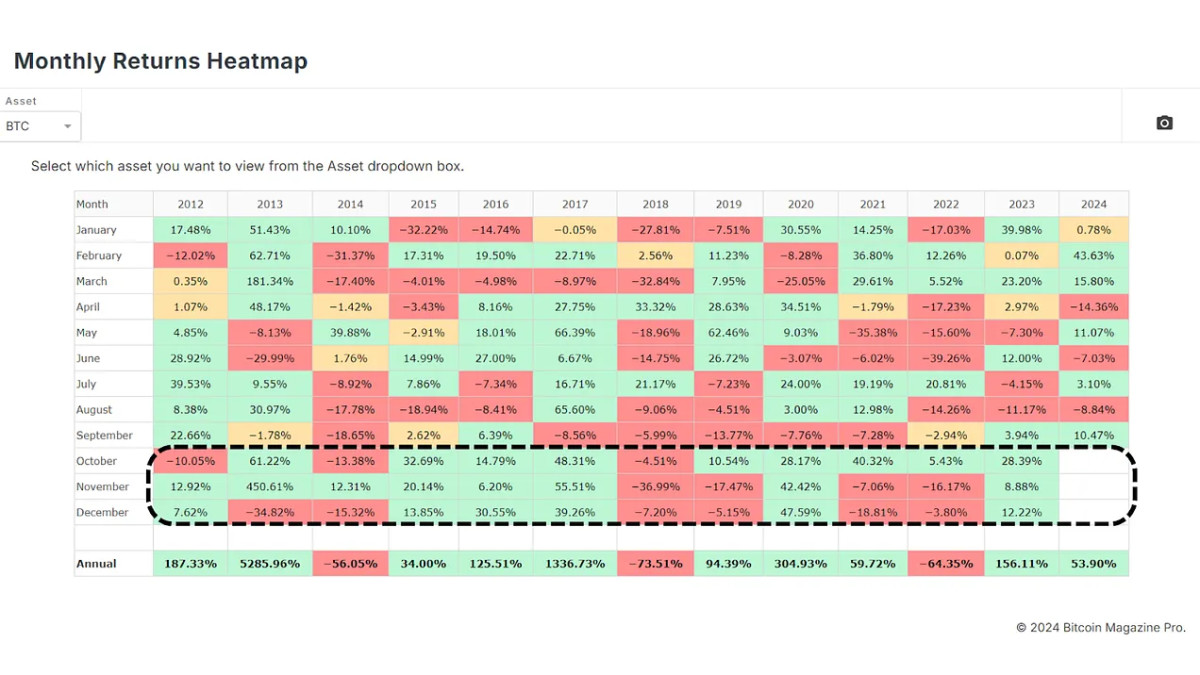
Reviewing the last decade on the Monthly Returns Heatmap, it’s clear that Q4 has consistently provided notable returns for Bitcoin. Historical data indicates that BTC often concludes the year on a high note, as shown by three consecutive positive months in 2023. However, not every year conforms to this pattern; 2021 and 2022 ended on a bearish note for Bitcoin. Conversely, years like 2020 and the span from 2015 to 2017 witnessed remarkable price boosts, underscoring the potential for a positive close in Q4.

Examining Possible Outcomes for Q4 2024 Based on Historical Patterns
To gain insight into potential outcomes for Q4 2024, we can compare prior Q4 performances with current price trends. This analysis can provide a perspective on how Bitcoin might respond if historical behaviors recur. The possible outcomes range widely, encompassing substantial gains, minor losses, or sideways movements. The projection lines are color-coded, transitioning from 2023 in red to 2015 in a light violet hue.
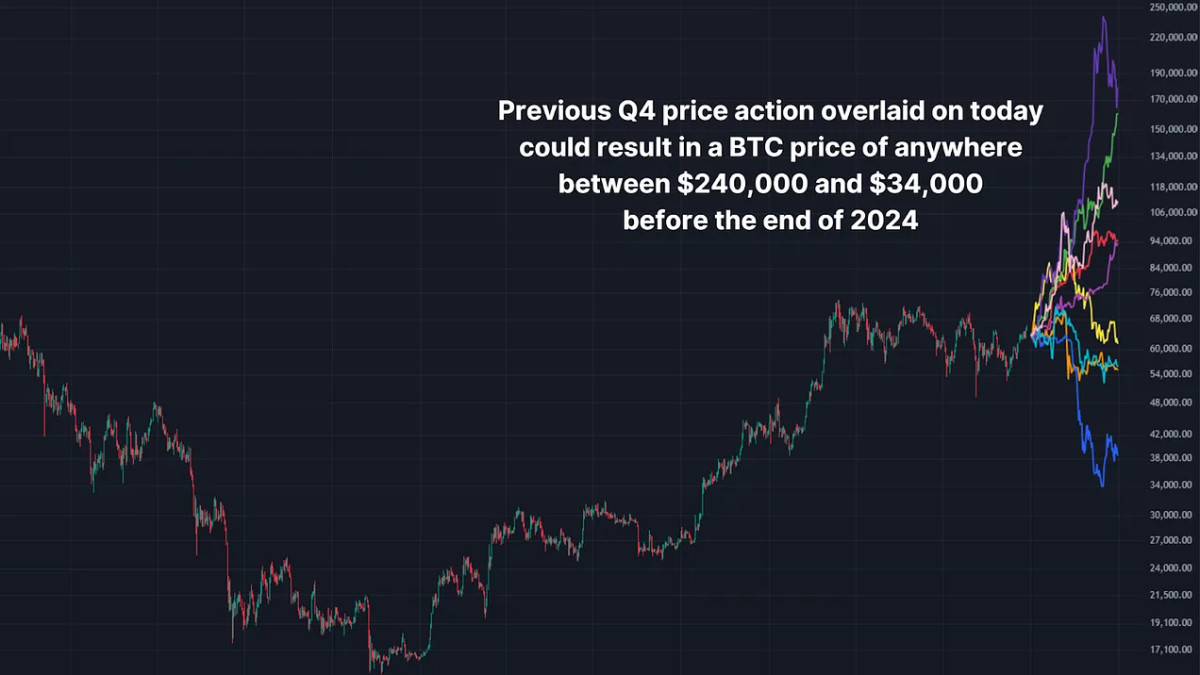
For instance, in 2017 (represented by the purple line), Bitcoin saw a considerable rise, indicating that in a favorable scenario, Bitcoin could reach values of up to $240,000 by the end of 2024.
Nevertheless, more conservative projections exist. In a moderate Q4, Bitcoin might range between $93,000 and $110,000, while in a bearish outlook, prices could fall to as low as $34,000, reminiscent of 2018 (indicated by the blue line).
The median outcome derived from this analysis appears to sit around the $85,000 mark. While this is based on projected year-end prices, years like 2021 (shown by the yellow line) saw significantly higher prices before major pullbacks by year-end.
Is the Median Outcome Feasible?
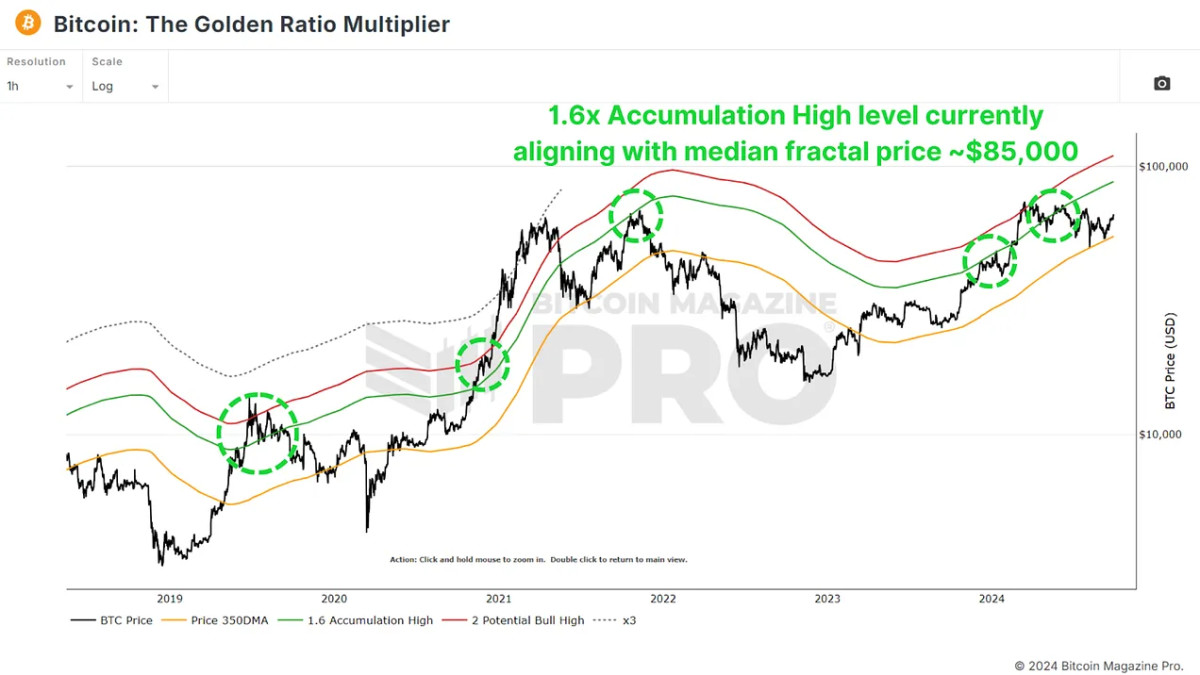
While an $85,000 price point within three months may appear overly optimistic, looking back to February of this year illustrates a single month where BTC experienced a surge of 43.63%. Additionally, metrics such as The Golden Ratio Multiplier indicate convergence around this level as a potential target with its 1.6x Accumulation High.
Is $240,000 Achievable?
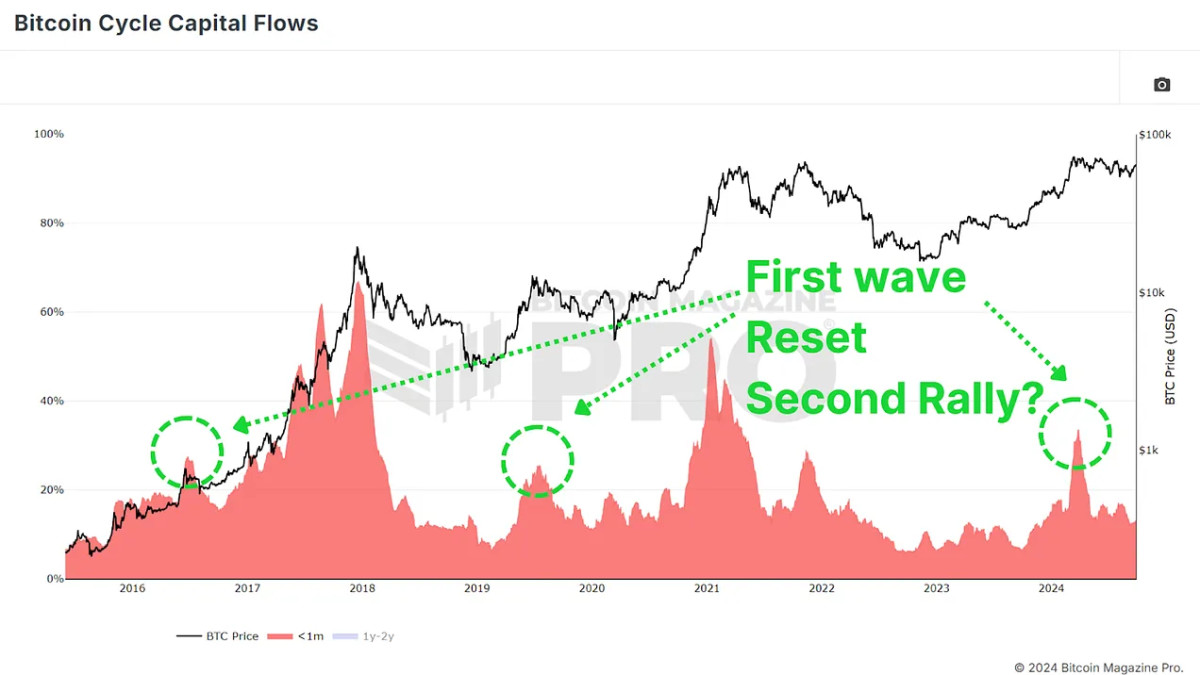
Whether Bitcoin can attain such lofty figures is contingent on numerous factors. An uptick in demand, paired with limited supply, could propel Bitcoin to unprecedented heights. Moreover, developments like Bitcoin ETFs, institutional investments, or significant geopolitical events could further enhance demand. We’re also observing trends in this cycle that mirror those from previous cycles, characterized by a initial wave of substantial market inflows followed by a cooldown period, potentially setting the stage for a second rally in the coming months.
This may be ambitious; Bitcoin’s market cap has seen substantial growth since 2017, necessitating tens of billions in new investments. However, Bitcoin’s nature allows for surprises, and nothing should be dismissed in this market!
Conclusion
In conclusion, while historical data indicates a positive outlook for Q4, forecasting Bitcoin’s future remains inherently speculative. A significant fraction of examined projections resulted in sideways price action, with some even predicting considerable declines. Ultimately, it’s crucial for investors to stay objective and respond to Bitcoin’s trends rather than solely attempting to predict them.
For a deeper exploration of this topic, check out our latest YouTube video here:
Bitcoin Q4 – A Positive End To 2024?


 Dutch
Dutch English
 French
 German
 Greek
Greek Italian
 Portuguese
 Russian
 Spanish