


The frog-inspired meme coin Pepe (PEPE) has experienced a remarkable 40% surge in just the past week, aligning with a general sense of relief sweeping through the broader market.
While the recent advancements have generated quite a buzz, data indicates that Pepe has encountered a significant liquidity barrier that may impede further upward movement. This analysis outlines what traders and investors might anticipate as the meme coin encounters heightened resistance.
Pepe Signal Raises Concerns Over Further Growth
On September 16, Pepe’s price stood at $0.0000071. However, the gains over the last fortnight have propelled the price to $0.000011 — the current level it occupies. Given this trend, there are speculations that PEPE could ascend toward $0.000015.
Nevertheless, the In/Out of Money Around Price (IOMAP) indicates that reaching this target might prove difficult. The IOMAP assesses the average price at which holders acquired a token and highlights whether they are currently profiting based on the prevailing price.
A price range with a high transaction volume can function either as support or resistance. In the case of PEPE, the volume realized between $0.000011 and $0.00012 tallies to 8.62 trillion tokens, amounting to around $95 million, and these are currently underwater.
Read more: How To Purchase Pepe (PEPE) and Essential Information
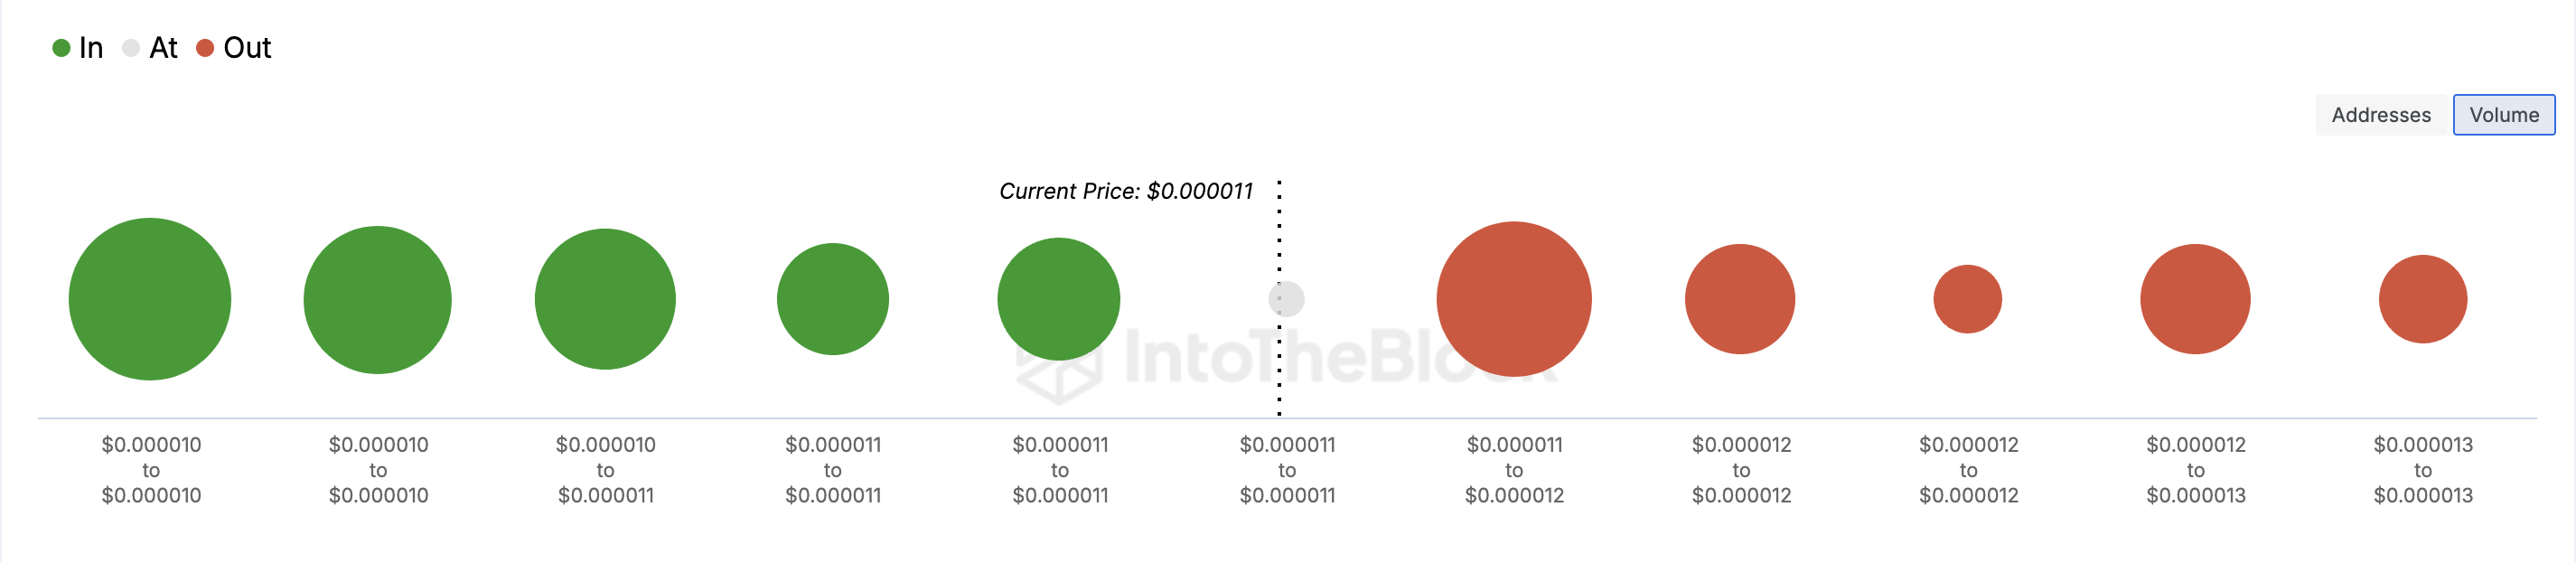
This $95 million exceeds the volume bought in the price range of $0.000010 to $0.000011. The greater accumulation suggests that the meme coin might confront a sell wall as it approaches $0.000012. As a result, an inability to overcome this resistance could halt the ongoing uptrend.
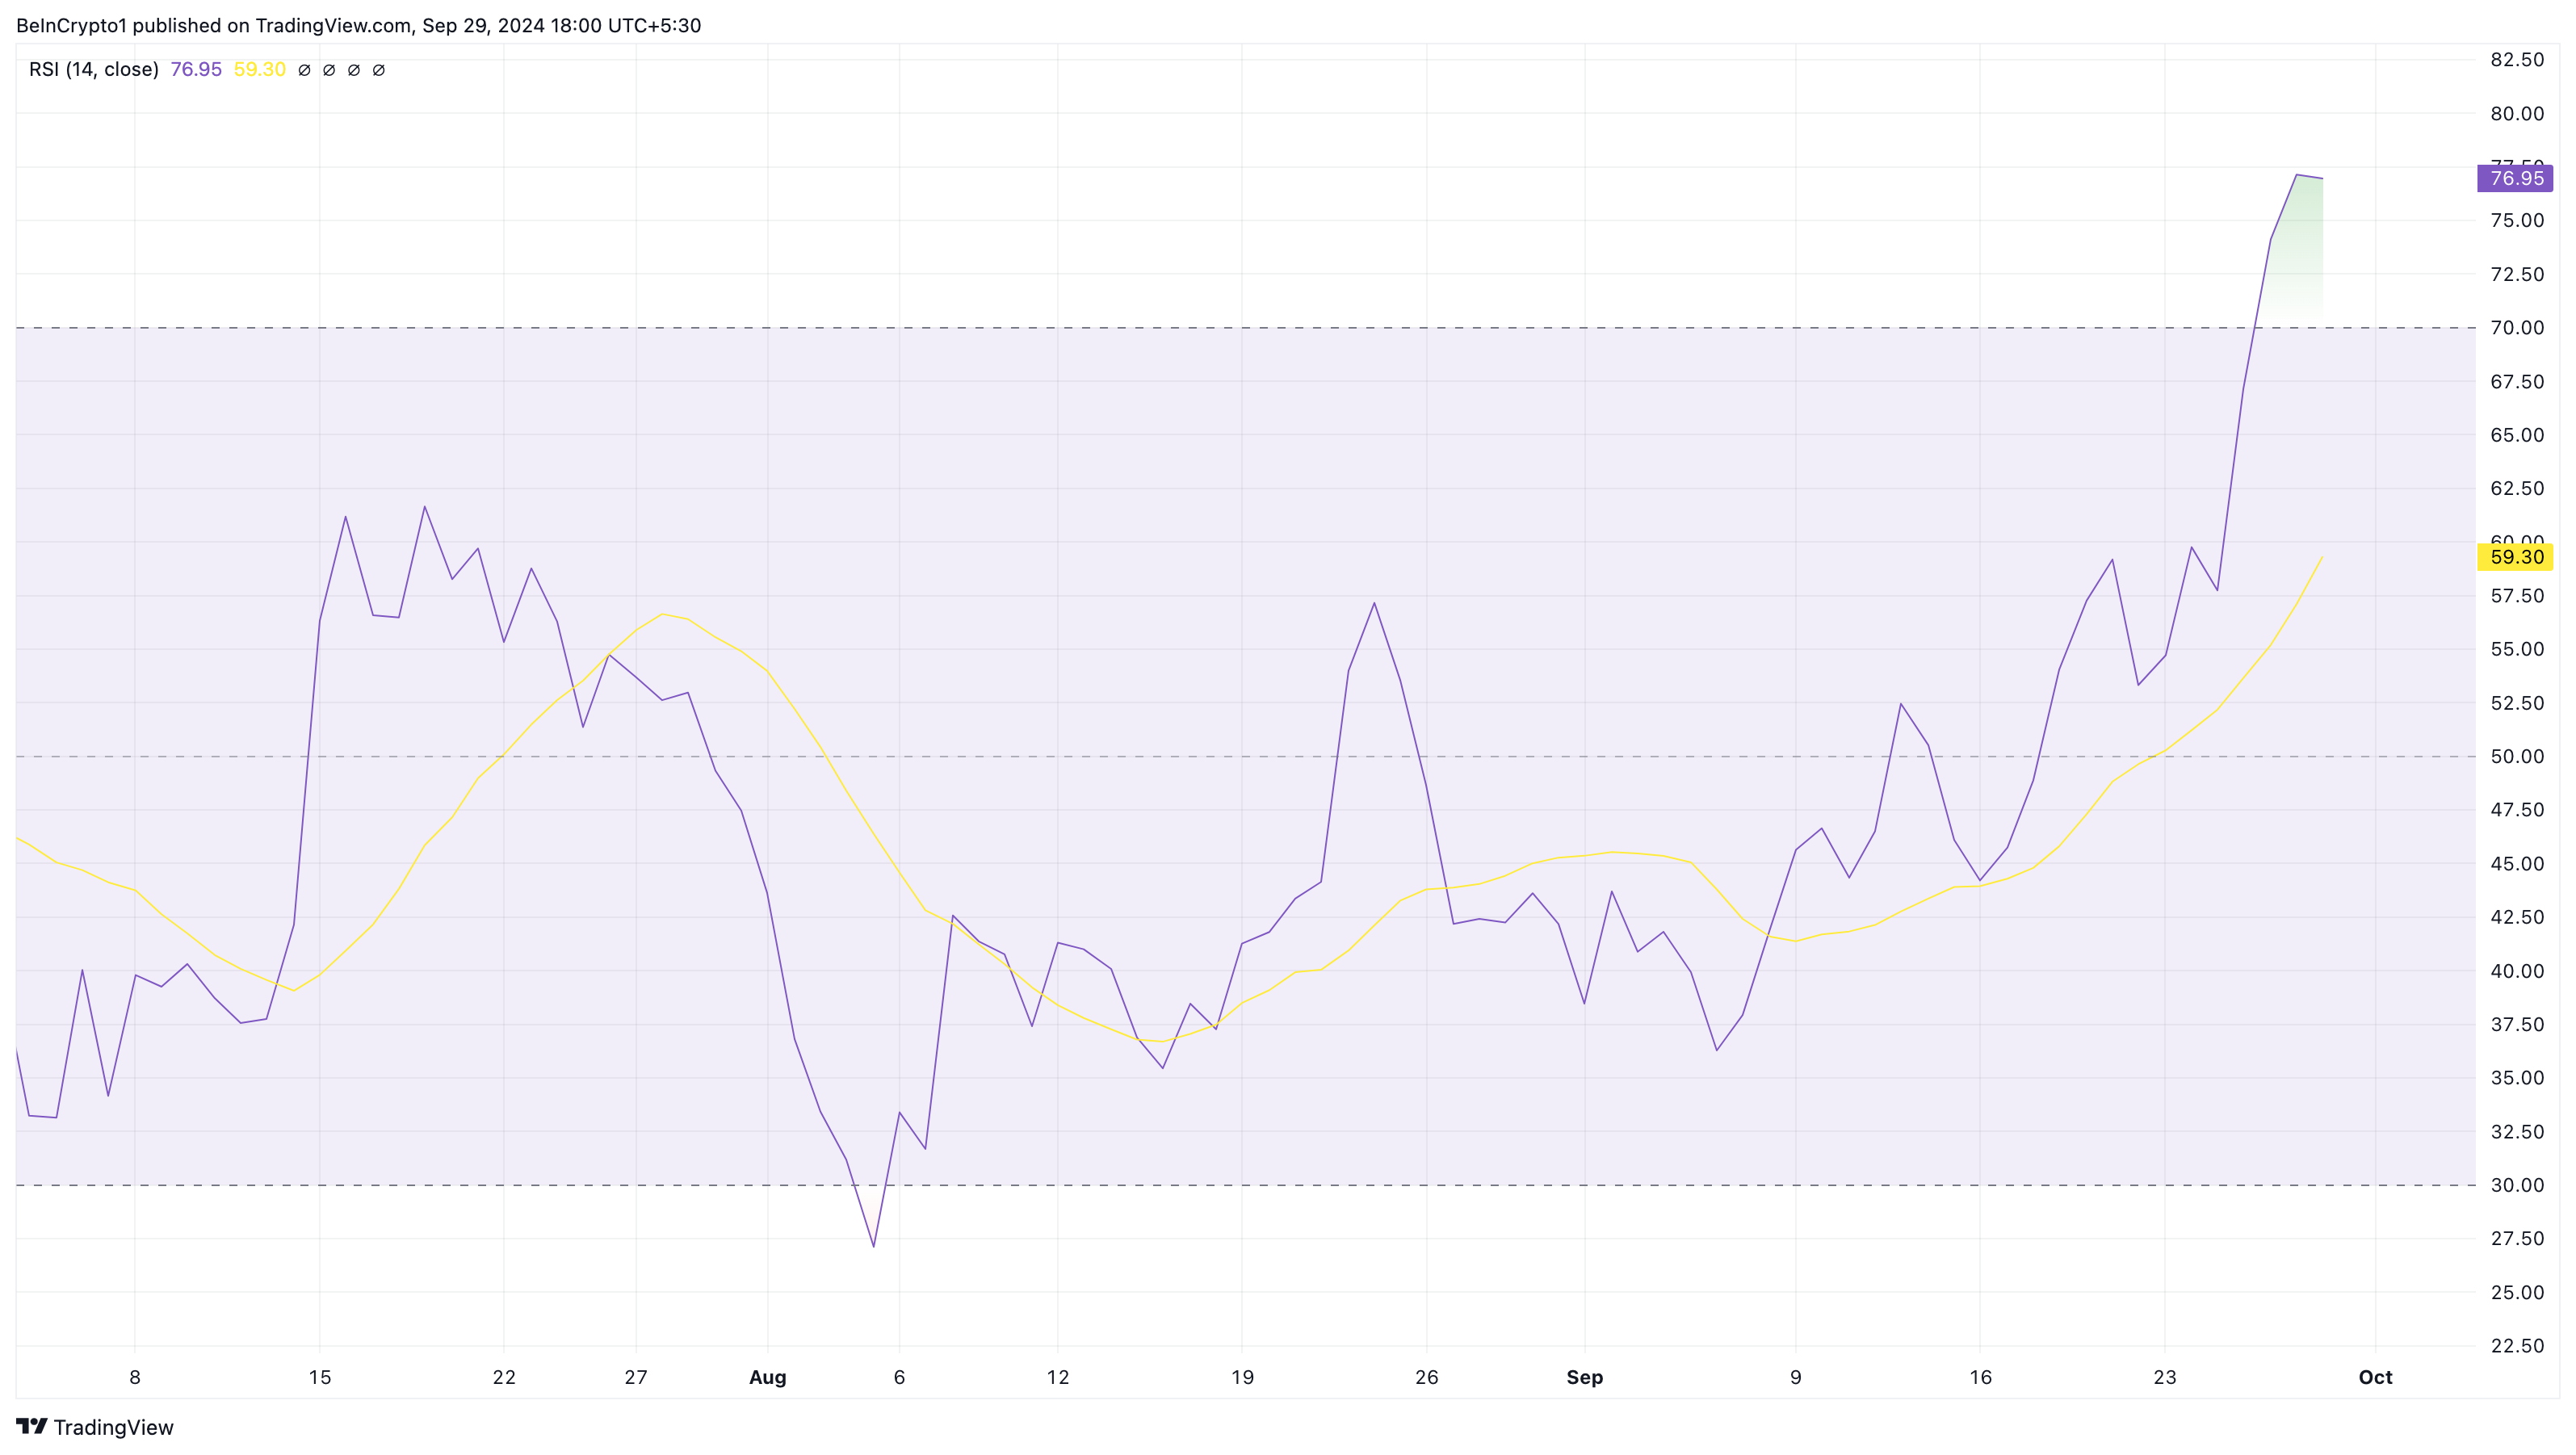
Another factor contributing to this outlook is the Relative Strength Index (RSI), a technical tool used to gauge momentum. An ascending RSI indicates bullish momentum, while a decreasing figure hints at bearish movements.
The RSI also indicates whether a cryptocurrency is in an overbought or oversold condition. Readings above 70.00 signify overbought conditions, while those below 30.00 indicate oversold status. The RSI for the PEPE/USD daily chart reveals that the token is currently overbought, implying a potential price drop ahead.
PEPE Price Forecast: Bearish Days Ahead
As of now, PEPE’s price is at $0.000011. However, the daily chart reveals the emergence of a sell signal as the meme coin tries to penetrate the supply zone around $0.000013.
This shift may pose difficulties for the token to reach the anticipated $0.000015 target. Instead, it may need to concentrate on preserving support at $0.000010. If the token fails to uphold this critical level, it could face severe repercussions, potentially resulting in a decline to $0.0000095.
Read more: 5 Best Wallets for Pepe (PEPE) for Beginners and Experienced Users
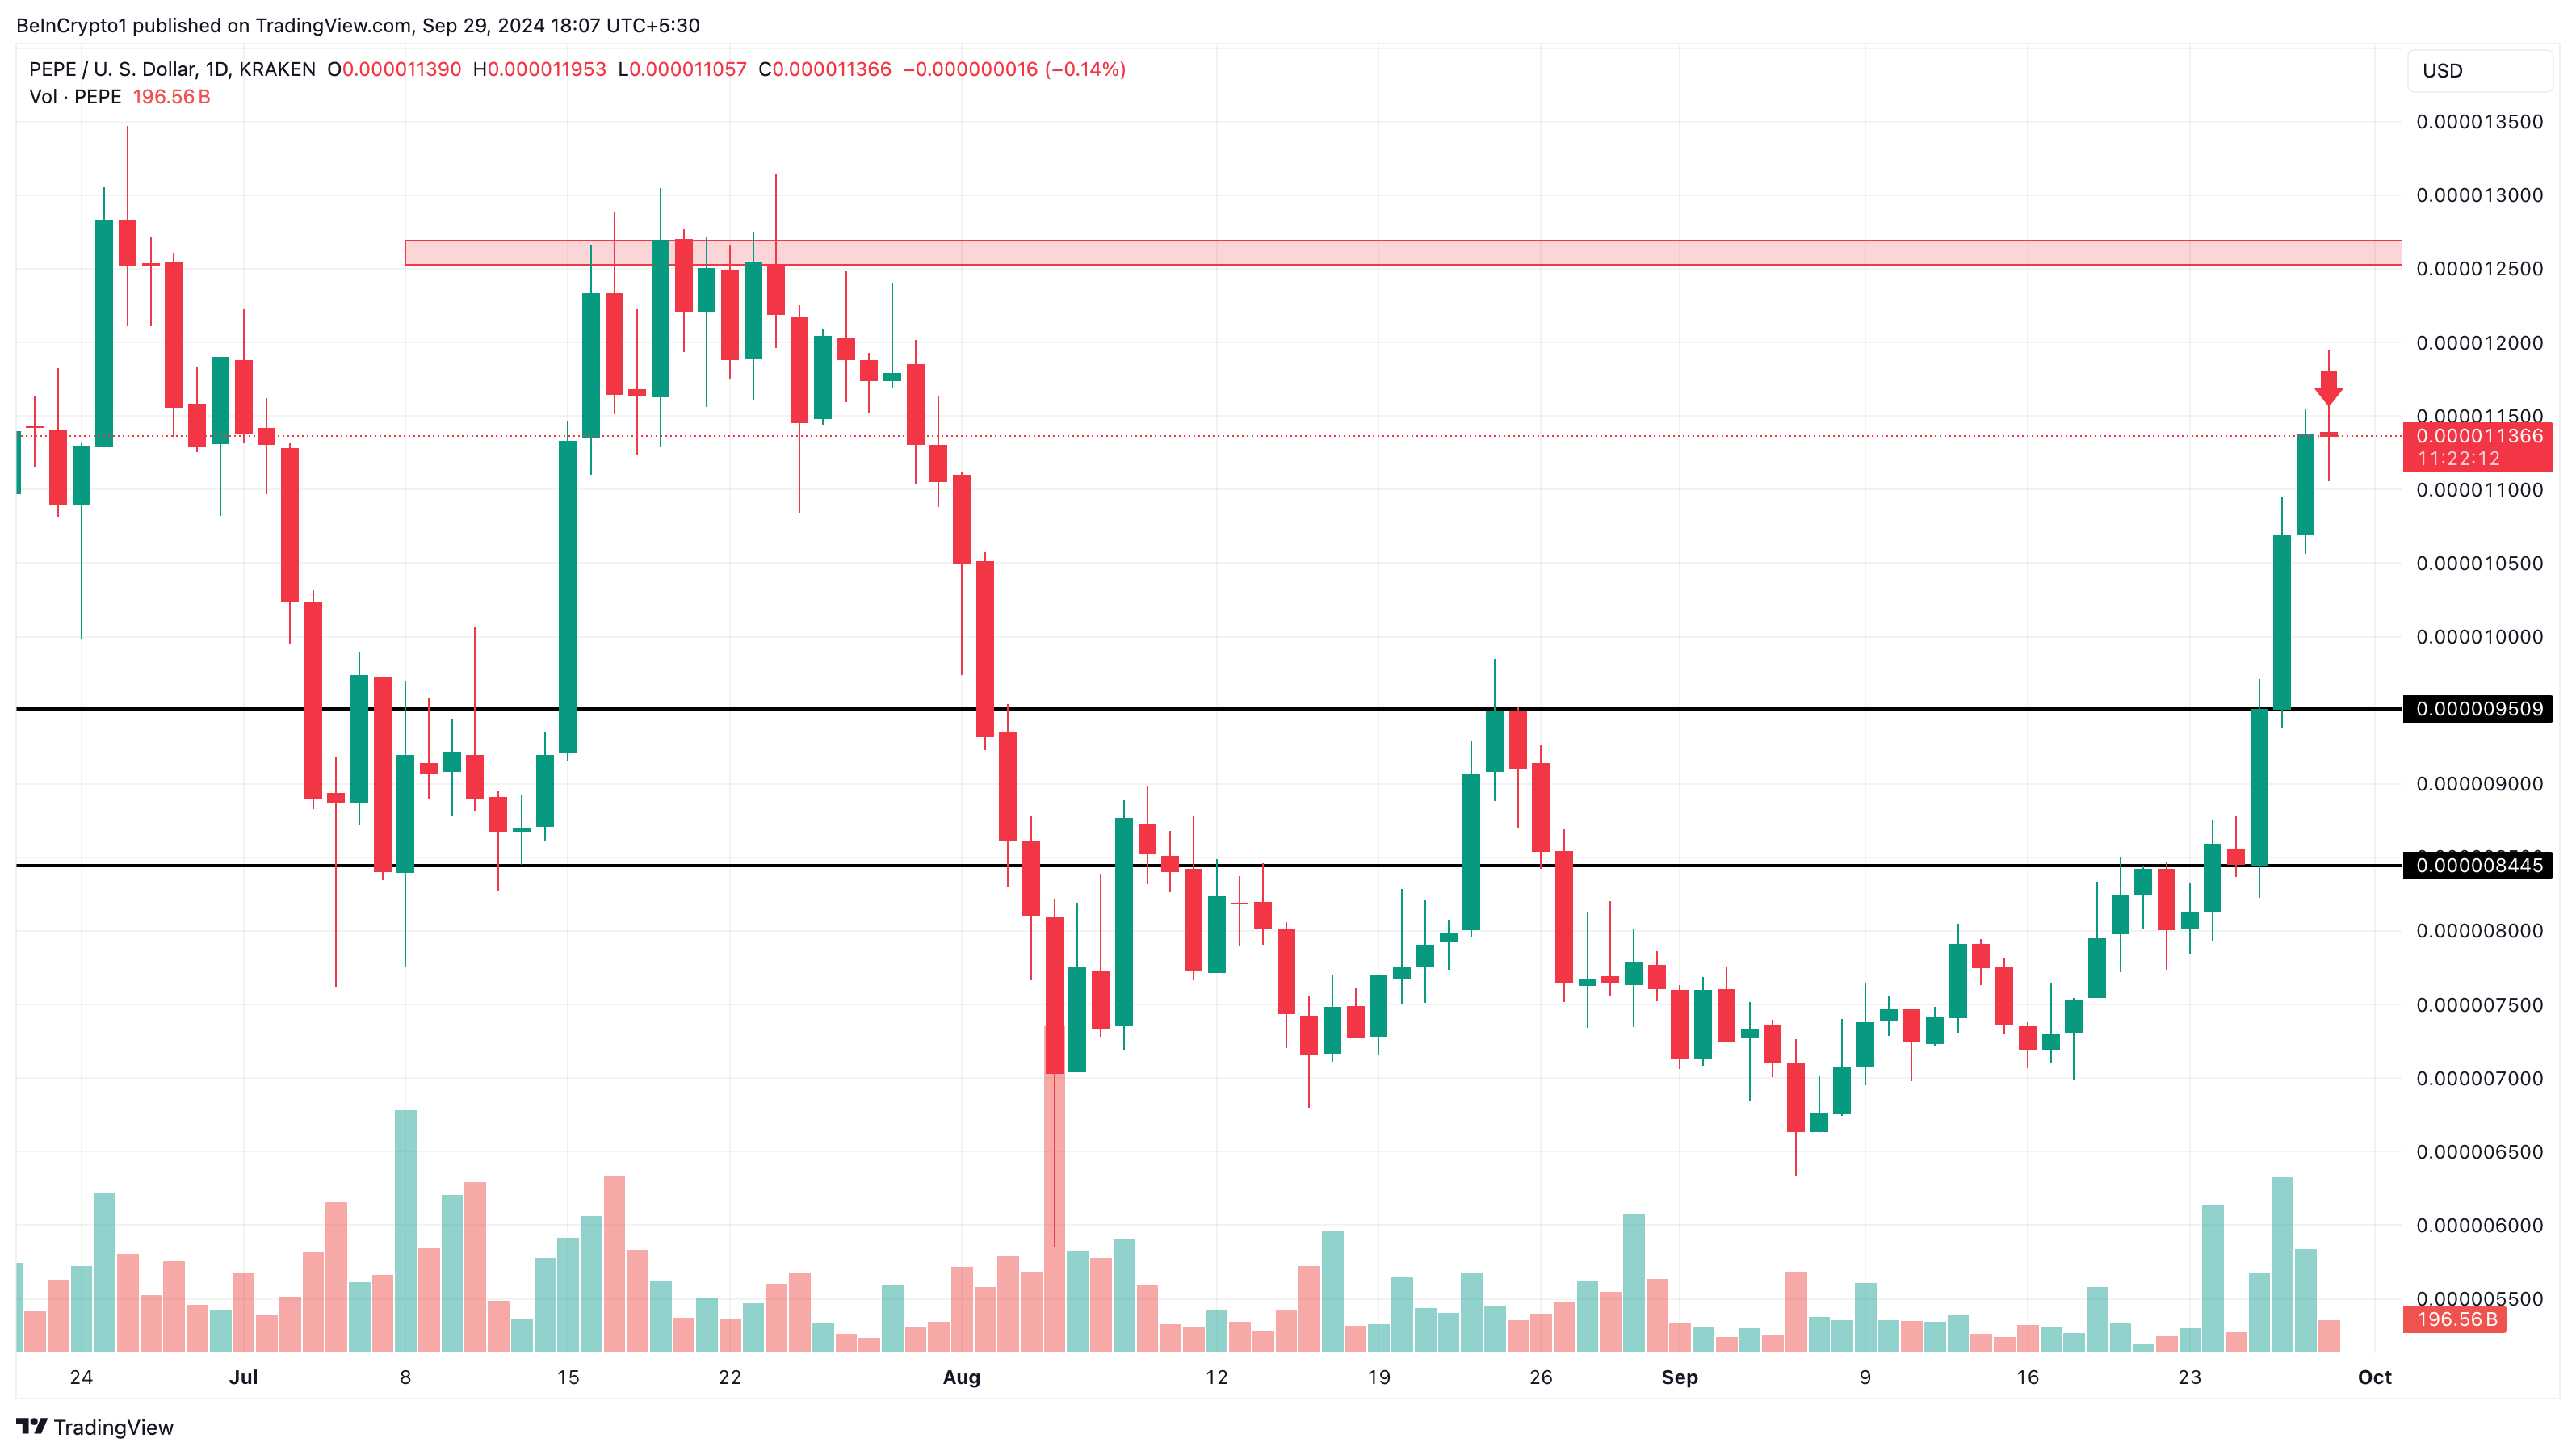
In a notably bearish scenario, PEPE’s price may decrease to $0.0000084. Conversely, the token’s value might resist further declines if bullish forces succeed in pushing it above $0.000013. In such a case, the cryptocurrency could edge closer to $0.000020.
Disclaimer
In accordance with the Trust Project guidelines, this price analysis article is intended solely for informational purposes and should not be regarded as financial or investment advice. BeInCrypto is devoted to providing accurate, unbiased reporting, but market conditions can change unexpectedly. Always perform your own research and consult with a professional before making any financial choices. Please be aware that our Terms and Conditions, Privacy Policy, and Disclaimers have been revised.


 Dutch
Dutch English
 French
 German
 Greek
Greek Italian
 Portuguese
 Russian
 Spanish