


- Ethereum ETFs recorded inflows of $84.6 million, yet they still significantly trail behind the inflows of Bitcoin ETFs.
- Even with recent price drops, Ethereum continues to stay above its 50-day moving average, suggesting a bullish trend in the short term.
According to the latest data, Ethereum [ETH] ETFs have had their highest inflow in over a month.
However, Ethereum ETF inflows still lag notably behind those of Bitcoin [BTC], which indicates a stronger inclination towards Bitcoin ETFs.
First weekly inflow since August
Information from SosoValue reveals that Ethereum ETFs saw over $84.6 million in inflows last week, benefiting from positive inflows on three out of five trading days.
This represents the largest weekly inflow since August 9th. Nevertheless, Ethereum ETF volumes still fall short compared to Bitcoin’s ETF activity.
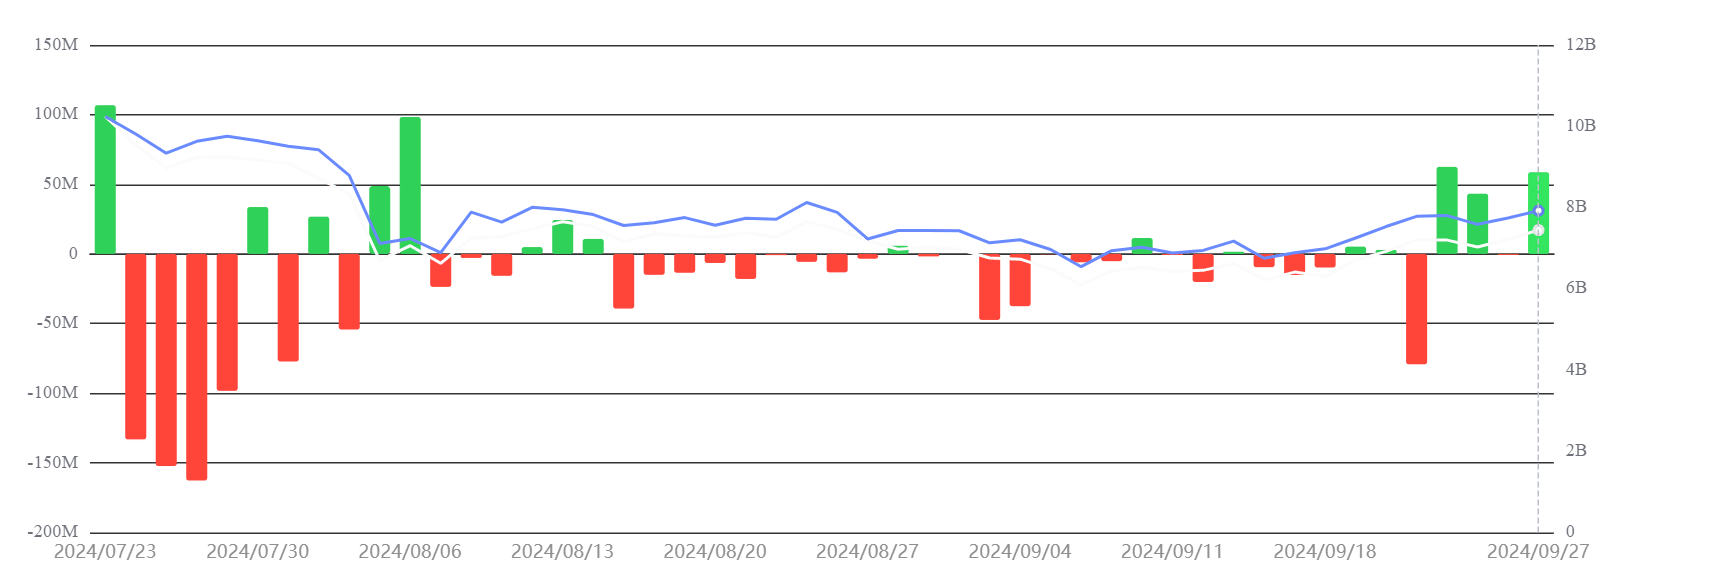
Source: SosoValue
In contrast, Bitcoin ETFs attracted an impressive $1.11 billion in inflows during the same week, with positive inflows happening every day.
This represented Bitcoin’s largest weekly inflow since July 19th.
Ethereum ETF continues to trail Bitcoin
Ethereum ETFs commenced trading in the U.S. on July 23rd, about six months after Bitcoin ETFs.
In the first five weeks post-launch, Ethereum ETFs experienced net outflows of approximately $500 million, whereas Bitcoin ETFs saw net inflows exceeding $5 billion.
Bitcoin’s established presence in the market is a major factor contributing to this difference.
While the launch of ETH’s ETF generated some excitement, it has not maintained the same level of attention over time as Bitcoin’s launch.
Moreover, the market capitalization disparity between the two assets is also significant—Bitcoin comprises over 50% of the crypto market cap, whereas Ethereum accounts for around 14%.
ETH price experiences decline as September concludes
Recently, Ethereum’s price has declined, dropping below the $2,600 mark.
At the moment of writing, Ethereum was trading around $2,597, reflecting a decline of over 2%. Notwithstanding this drop, ETH remains above its 50-day moving average, which suggests a prevailing bullish trend.
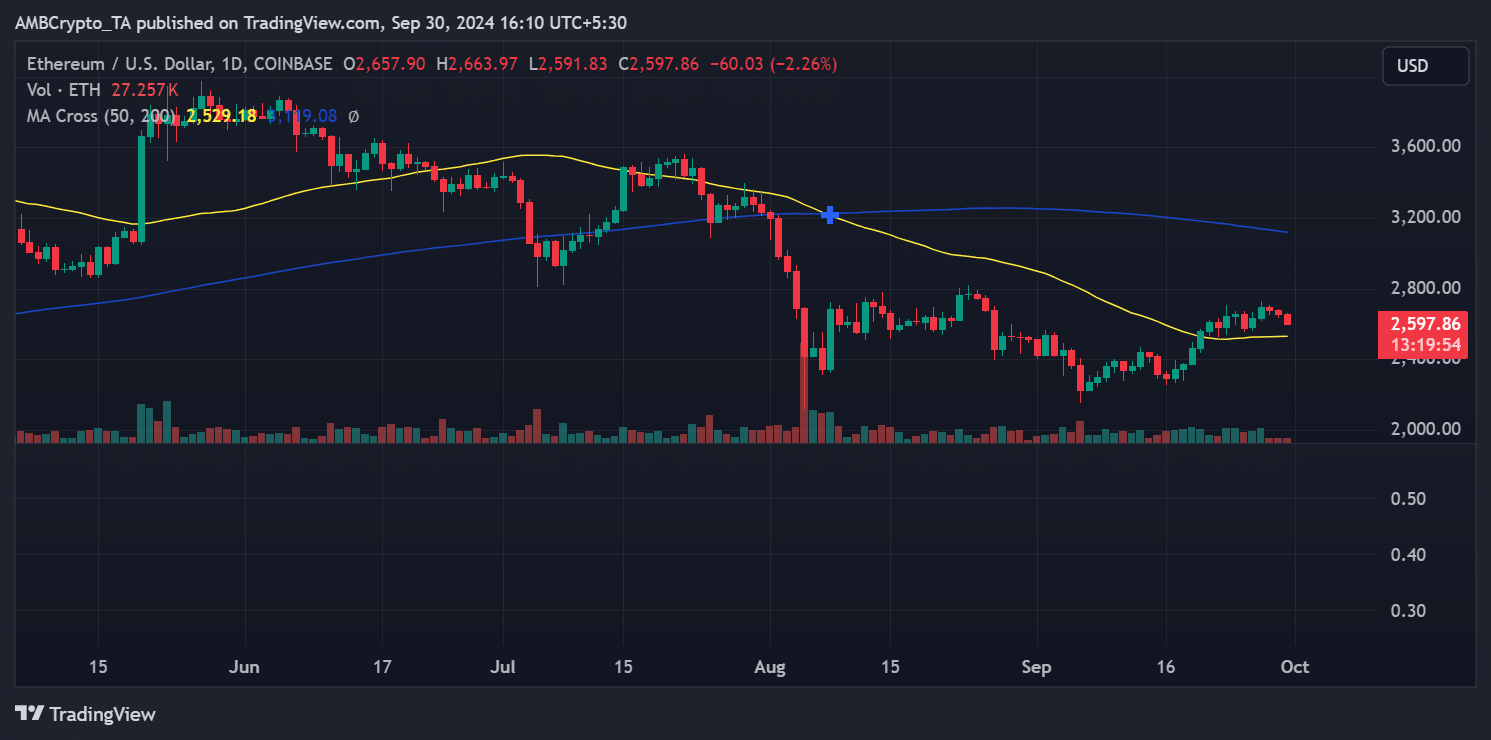
Source: TradingView
The Relative Strength Index (RSI) stood near 53, supporting the bullish indications highlighted by the moving average.
Realistic or not, here’s ETH market cap in BTC’s terms
While the Ethereum ETF has witnessed a significant inflow after a period of stagnation, it still immensely trails behind Bitcoin ETFs in terms of interest and volume from investors.
Factors including Bitcoin’s first-mover advantage and its dominance in the market significantly influence this trend. Despite recent price downturns, Ethereum remains in a favorable bullish position, staying above critical technical indicators.


 Dutch
Dutch English
 French
 German
 Greek
Greek Italian
 Portuguese
 Russian
 Spanish