


The price of Dogecoin saw a notable decline this week, dropping over 20% at its lowest point, from a Saturday high of $0.1321 to a Tuesday low of $0.1026. However, on-chain data and expert insights indicate a potentially positive outlook for this well-known meme coin.
Dogecoin Price Remains Optimistic
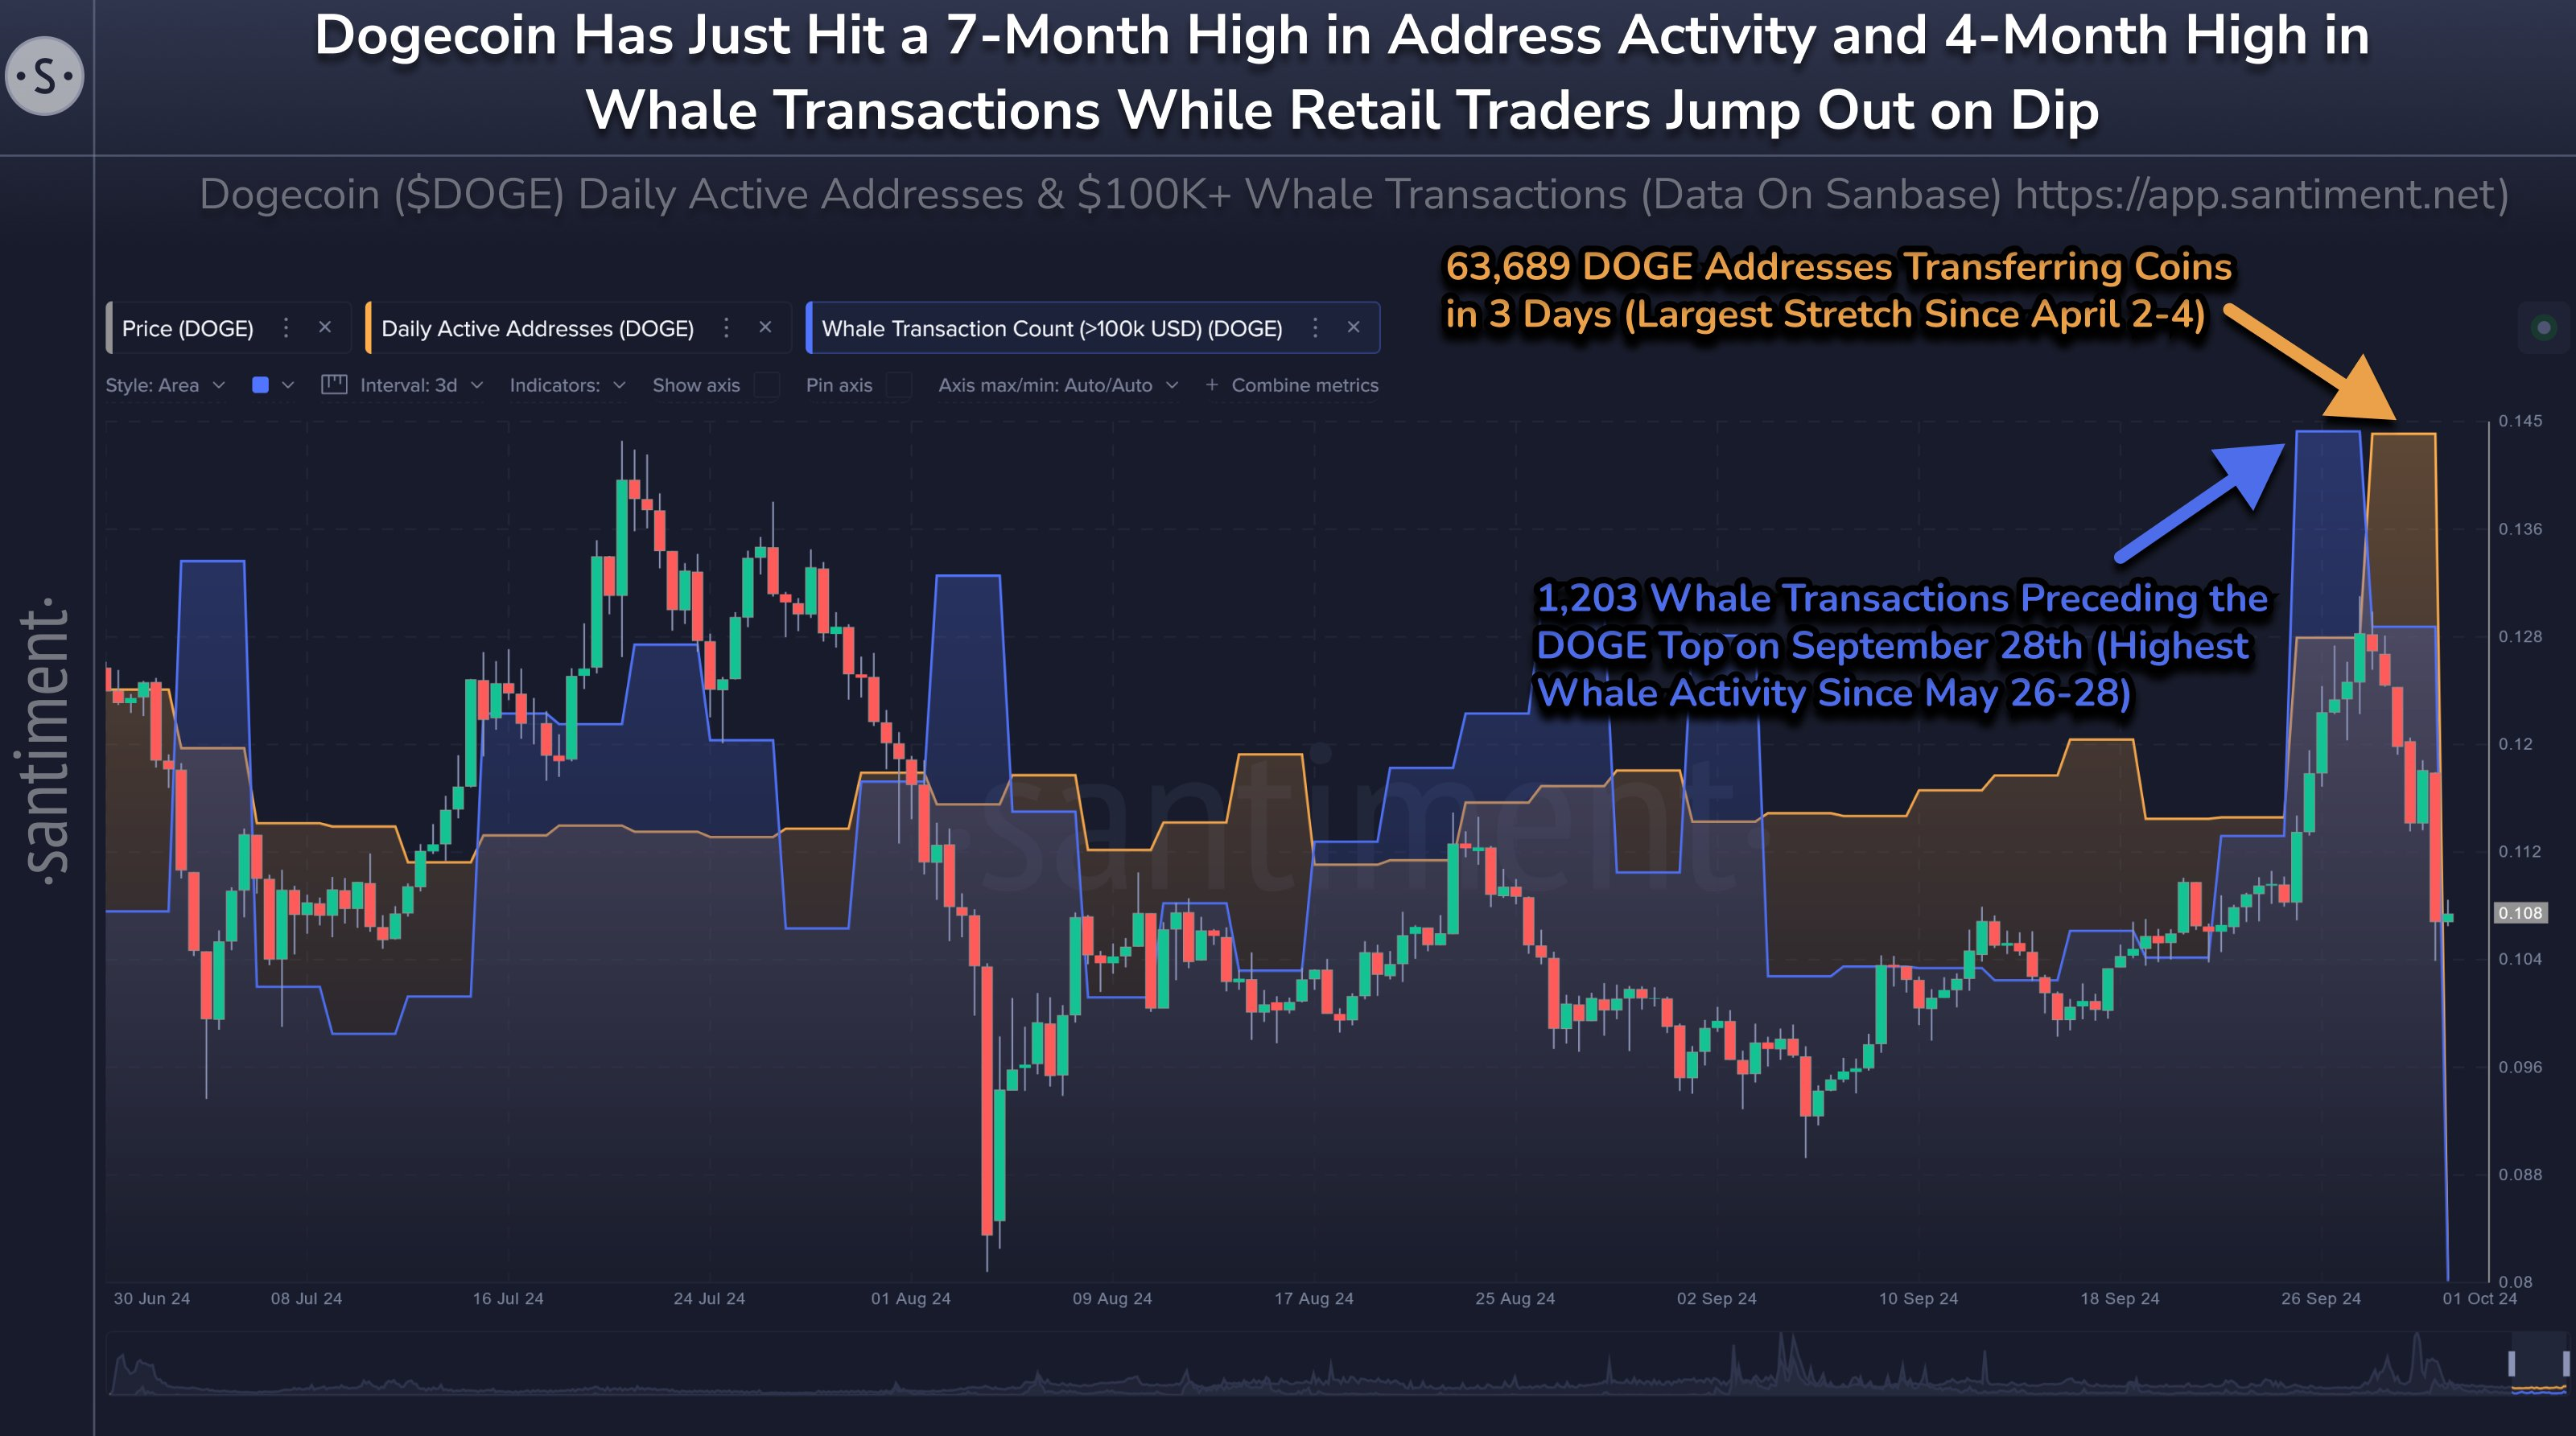
The on-chain analytics company Santiment has shared an in-depth analysis of Dogecoin’s activity on X today, highlighting strong engagement from large holders, or whales, in the cryptocurrency’s ecosystem. “Dogecoin has retraced -18% from its peak last Saturday. Nonetheless, on-chain activity suggests that whales might still be maintaining their bullish enthusiasm for the leading meme coin. Although profits were taken just before its peak, their participation in DOGE’s network remains notably elevated,” reported Santiment.
The analytics firm additionally noted a rise in Dogecoin’s network activity, pointing out that Dogecoin recently achieved a 7-month peak in address activity, alongside a 4-month high in whale transactions as retail transactions increased during the price dip.
Related Reading
In the past three days, 63,689 DOGE addresses have executed transfers, marking the most significant period since April 2-4. Additionally, there were 1,203 whale transactions (greater than $100,000) preceding the local Dogecoin price peak on September 28th, showcasing the highest whale activity since May 26-28.
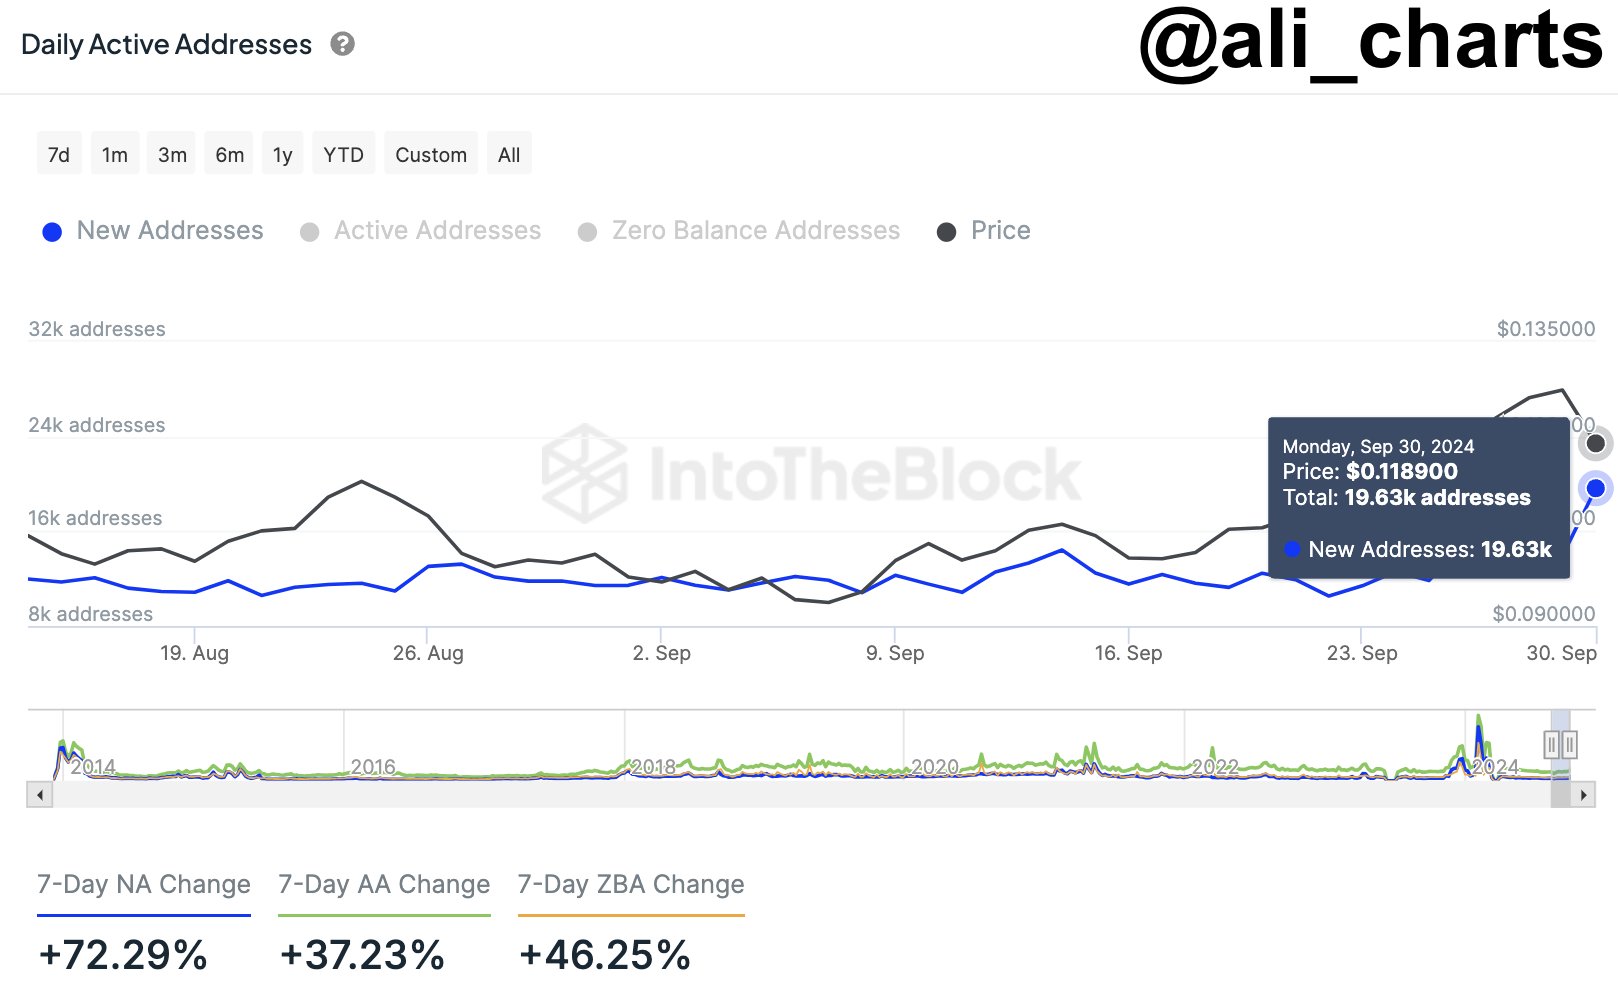
Crypto analyst Ali Martinez emphasized the substantial activity within the network on X. Martinez noted: “The Dogecoin network is witnessing remarkable growth! In the last week, there has been a 72% rise in new DOGE addresses, and just yesterday, 19,630 new DOGE addresses were established!”
The crypto analyst further strengthens the positive sentiment surrounding Dogecoin with his technical analysis. Martinez points out that DOGE may be approaching a MACD bullish crossover on the weekly chart, potentially signaling upcoming price increases. “The last two instances when Dogecoin DOGE experienced a MACD bullish crossover on the weekly chart resulted in rallies of 90% and 180%. A new MACD bullish crossover might be forming soon!” he clarified.
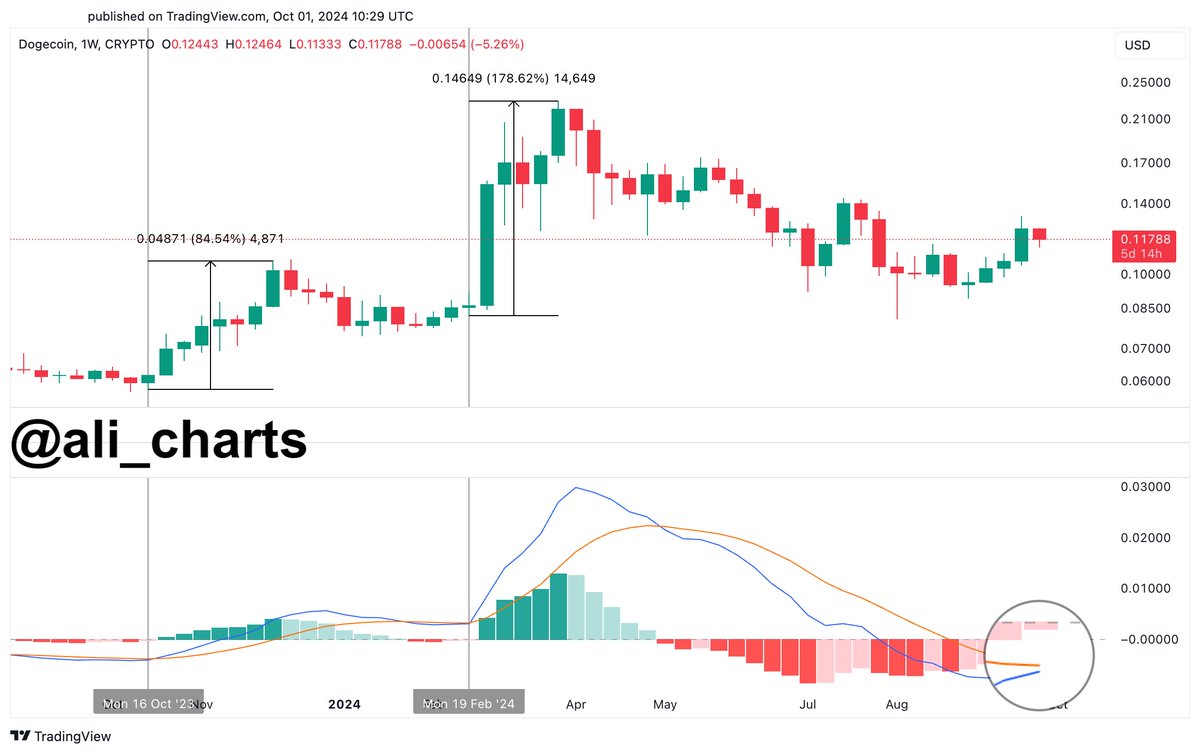
The MACD, or Moving Average Convergence Divergence, is a significant aspect of technical analysis. It comprises two lines: the MACD line, which is the differential between the 26-period and 12-period exponential moving averages (EMAs), and the signal line, which represents the 9-period EMA of the MACD line. A bullish crossover, where the MACD line moves above the signal line, usually indicates a transition from a bearish to a bullish market trend, often interpreted as a buy signal.
Related Reading
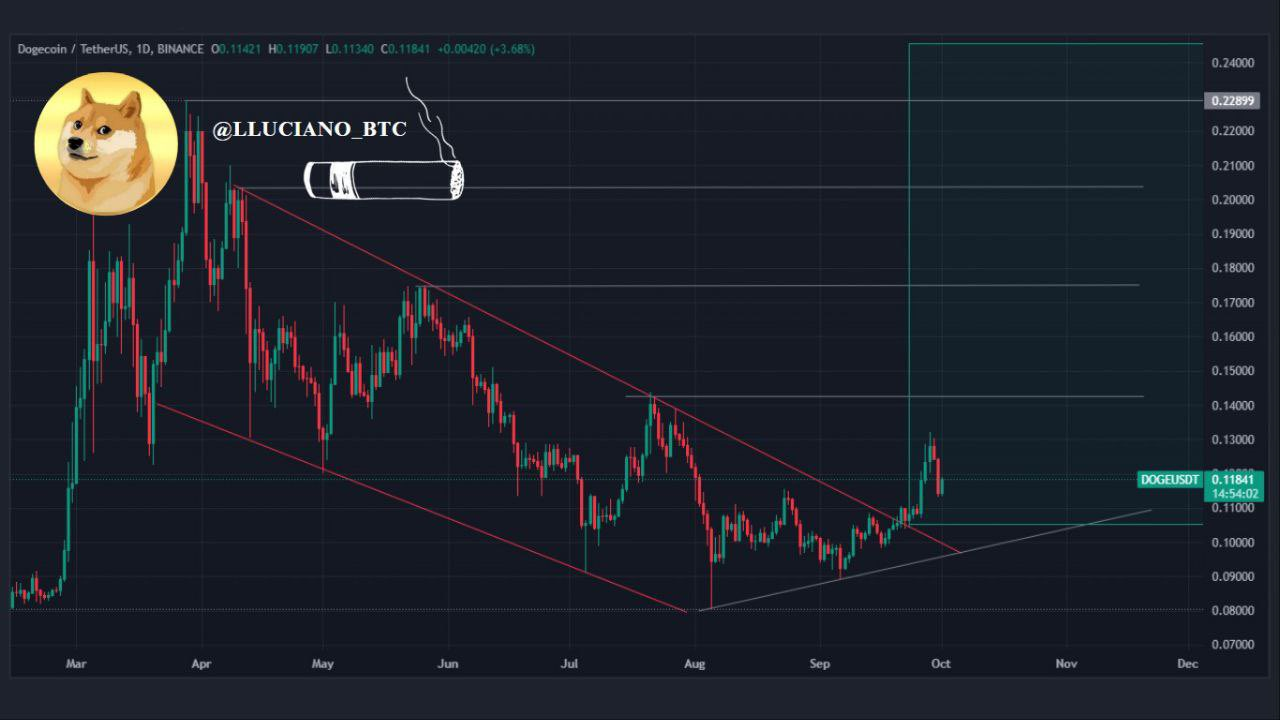
Another respected crypto analyst, Luciano, has noted a breakout from a descending channel on the daily chart. He advised his 2.2 million followers on X: “DOGE has seen a good run lately, and it seems this trend will continue. I believe dips are for buying, and DOGE is poised for a remarkable season this cycle. Do Your Own Research – Not Financial Advice.”
As of the time of reporting, DOGE was trading at $0.1087.
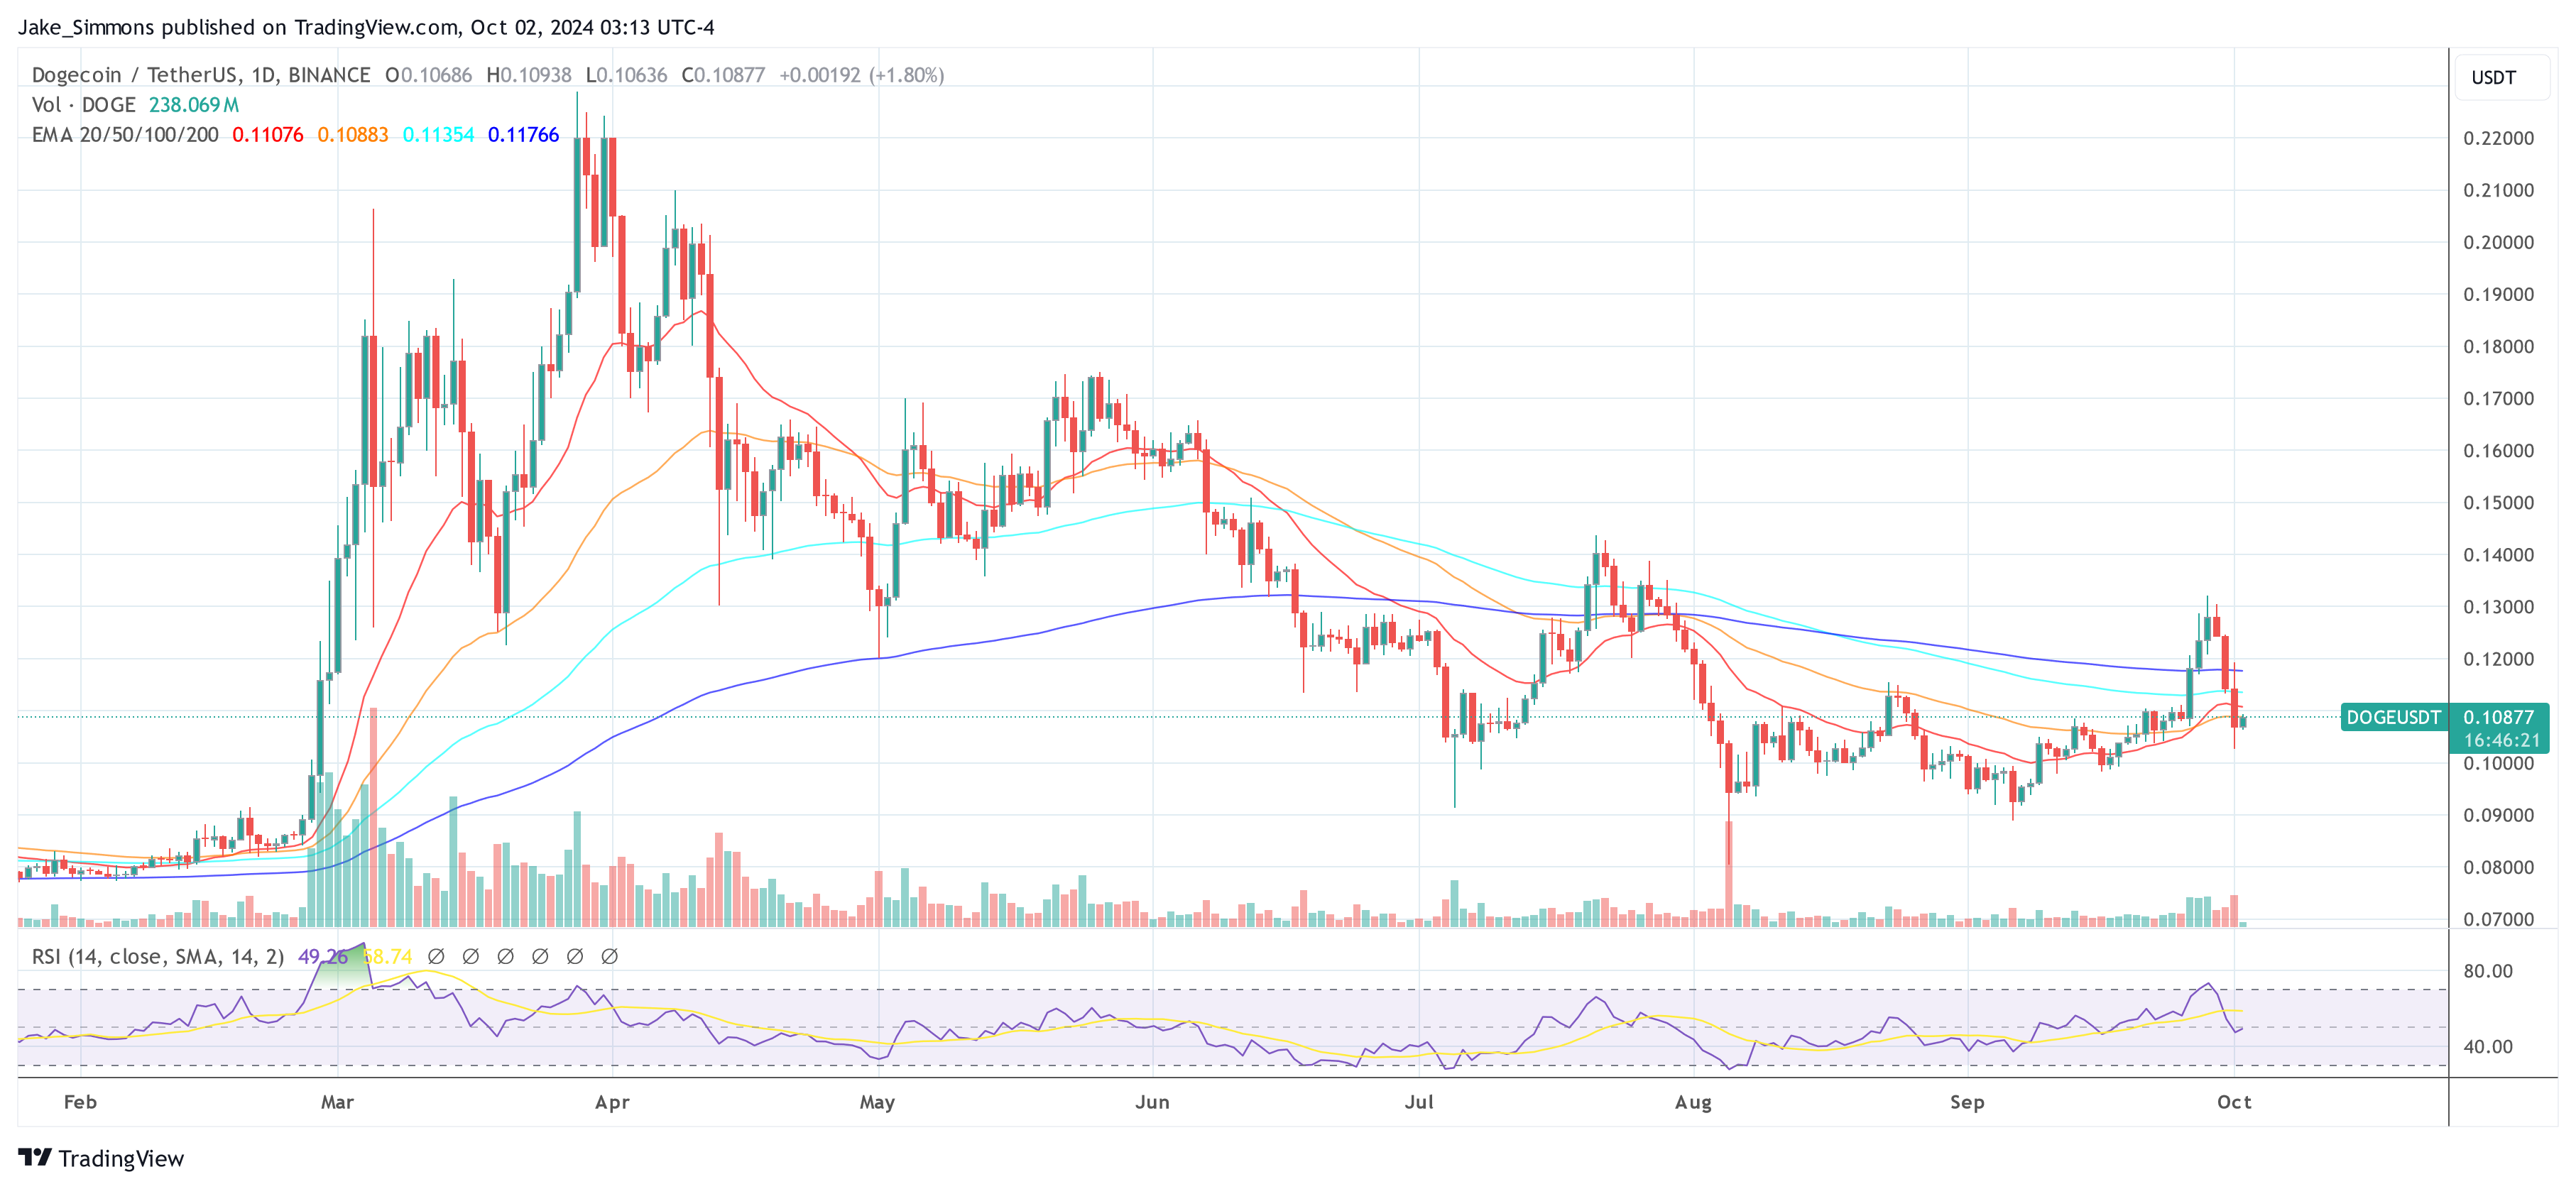
Featured image generated with DALL.E, chart sourced from TradingView.com


 Dutch
Dutch English
 French
 German
 Greek
Greek Italian
 Portuguese
 Russian
 Spanish