


Following a brief pullback, BONK is indicating signs of renewed strength as bullish momentum starts to build. The recent market activity shows that bulls have regained dominance, elevating the token from its recent downturn.
With the market evolving, traders are now looking at a possible upside breakout, with BONK’s subsequent targets becoming more defined. Is this the onset of a new rally, or will bears try to reclaim their influence again?
In this article, we will delve into BONK’s recent price dynamics after its pullback and examine the resurgence of bullish strength. By looking at key technical indicators, we’ll determine if this shift in momentum points to the likelihood of further upside and a breakout, or if the token might encounter resistance soon.
Technical Indicators: Evidence of Building Bullish Momentum
Recently, BONK’s price has turned bullish on the 4-hour chart, bouncing back and surpassing the $0.00001792 resistance level. The meme coin is currently trading above the 100-day Simple Moving Average (SMA) and displaying strong momentum, with eyes set on the $0.00002962 target.
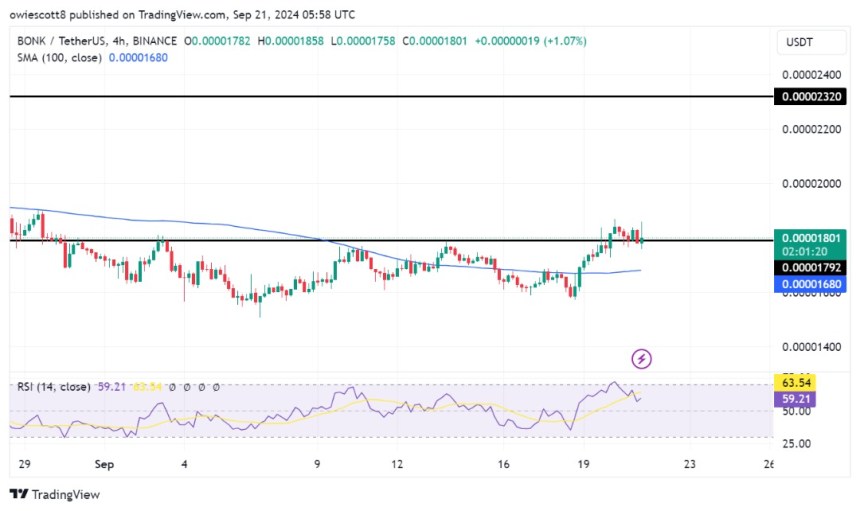
Analyzing the 4-hour Relative Strength Index (RSI) suggests that bulls may be ready to make a comeback. Although the RSI has fallen to 59% from an overbought condition, it remains above the 50% line, indicating that bullish momentum is still intact. This position suggests that while there has been some cooling off, the market has the potential for upward movement as long as the RSI maintains this key level.
Related Reading
Moreover, the daily chart reveals BONK showing positive momentum, highlighted by a rejection wick on the current daily candlestick. Despite trading below the 100-day SMA, this rejection wick illustrates that buyers are entering the market, helping to elevate the price and reducing selling pressure.
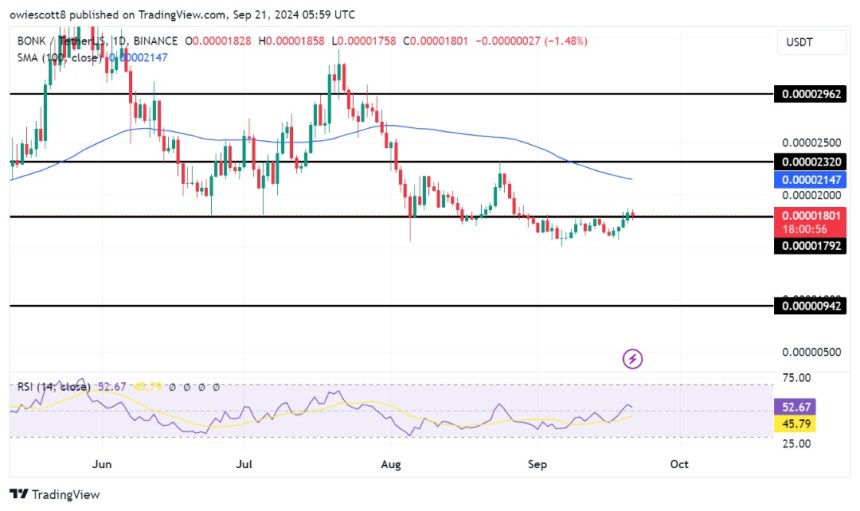
Lastly, the 1-day chart reveals a closer look at the RSI formation, indicating that BONK may fully resume its upward trajectory since the indicator’s signal line has ascended above the 50% mark and is currently at 53%.
Potential Upside Targets: What Lies Ahead for BONK?
As BONK showcases renewed bullish strength, significant resistance levels to monitor include the $0.00002320 mark, where previous price movements have faced challenges. Should BONK break through this barrier, it could open the doors for more advancements, possibly reaching the next target around $0.00002962 and beyond.
Related Reading
On the other hand, if BONK encounters significant resistance at $0.00002320, the price may either consolidate or try to revisit the $0.00001792 support level. A drop below this range, especially with strong volume, could indicate a continuation of the bearish trend, potentially targeting the support level at $0.00000942.
BONK was last trading around $0.00001803, reflecting a 2.33% decline over the past 24 hours. The cryptocurrency’s market capitalization is approximately $1.2 billion, with trading volume surpassing $128 million, indicating decreases of 2.32% and 23.11%, respectively.
Featured image from LinkedIn, chart from Tradingview.com


 Dutch
Dutch English
 French
 German
 Greek
Greek Italian
 Portuguese
 Russian
 Spanish