


The price of Bitcoin is maintaining its gains above the $67,000 resistance level. BTC is currently in a consolidation phase, aiming for additional gains above the $68,350 resistance.
- Bitcoin has shown stability and continued to increase above the $67,500 level.
- The current trading price is above $67,400 and surpassing the 100-hour Simple Moving Average.
- A significant bullish trend line is emerging, providing support at $67,400 on the hourly chart of the BTC/USD pair (data sourced from Kraken).
- The pair may experience further rallies with a close above the $68,200 resistance level.
Bitcoin Price Set for Further Increases
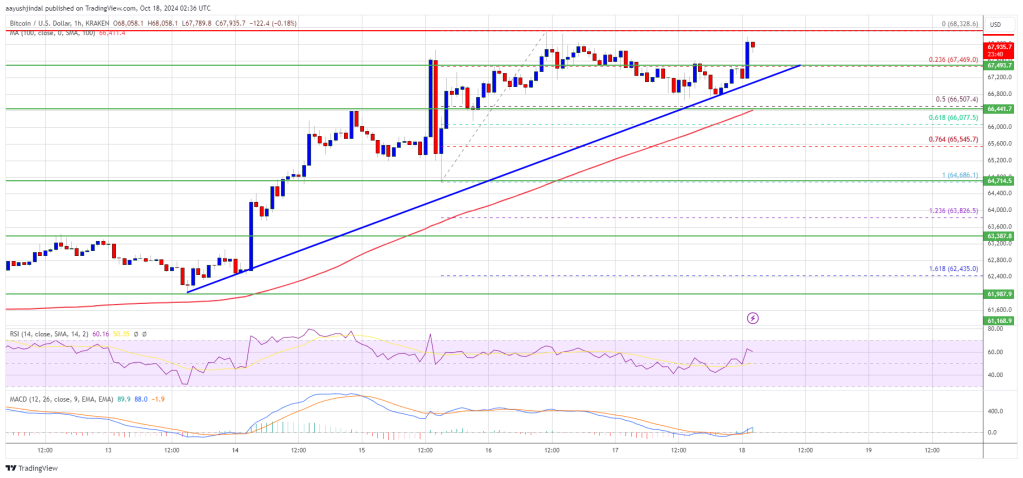
The price of Bitcoin continues to find support over the $67,000 pivot zone. BTC has remained range-bound, with bullish activity noted above the $66,500 mark. A slight pullback occurred following the recent peak of $68,328.
The price dipped below the $67,000 mark, crossing under the 23.6% Fib retracement of the upward trajectory from the swing low of $64,685 to the high of $68,328. Nevertheless, bulls remained active above the $66,500 level. A key bullish trend line is also forming with support at $67,400 on the hourly chart of the BTC/USD pair.
Currently, Bitcoin is trading above $67,200 and remains ahead of the 100-hour Simple Moving Average. Should the price break resistance near the $68,000 level, key resistance is positioned at approximately $68,200. A definitive movement beyond the $68,200 resistance may catalyze additional upward movement, with the next critical resistance around $68,850.
A close above the $68,850 resistance could trigger further gains, potentially driving the price toward the $71,650 resistance level. Any additional upward movement might see the price approach the $72,000 resistance level.
Could BTC Experience Another Decline?
Should Bitcoin fail to break above the $68,000 resistance zone, it may initiate another downward trend. Immediate support on the downside is situated near the $67,200 level and the trend line.
The first significant support level is around $66,500, also coinciding with the 50% Fib retracement of the upward movement from the $64,685 swing low to the $68,328 high. The next support level is located near the $66,000 zone. Continued losses might push the price down towards the $65,500 support level in the near term.
Technical indicators:
Hourly MACD – The MACD is picking up momentum in the bullish territory.
Hourly RSI (Relative Strength Index) – The RSI for BTC/USD has risen above the 50 threshold.
Major Support Levels – $67,200, followed by $66,500.
Major Resistance Levels – $68,000, and $68,200.


 Dutch
Dutch English
 French
 German
 Greek
Greek Italian
 Portuguese
 Russian
 Spanish