


- The price movement of XRP showed a modest bullish trend at the time of writing
- Insufficient demand suggested that the altcoin’s ascent could be gradual
On Thursday, the U.S. Securities and Exchange Commission submitted its latest appeal, aiming to overturn specific aspects of the ruling in favor of Ripple and XRP from July 2023. This comes despite the SEC no longer contesting that XRP sales through exchanges to retail investors did not constitute a sale of securities.
The effect of this appeal on XRP’s price has been minimal. Since July, XRP has predominantly traded within the $0.52 to $0.62 range, a trend that remains unchanged as the token continues to consolidate.
A positive response could bolster XRP buyers
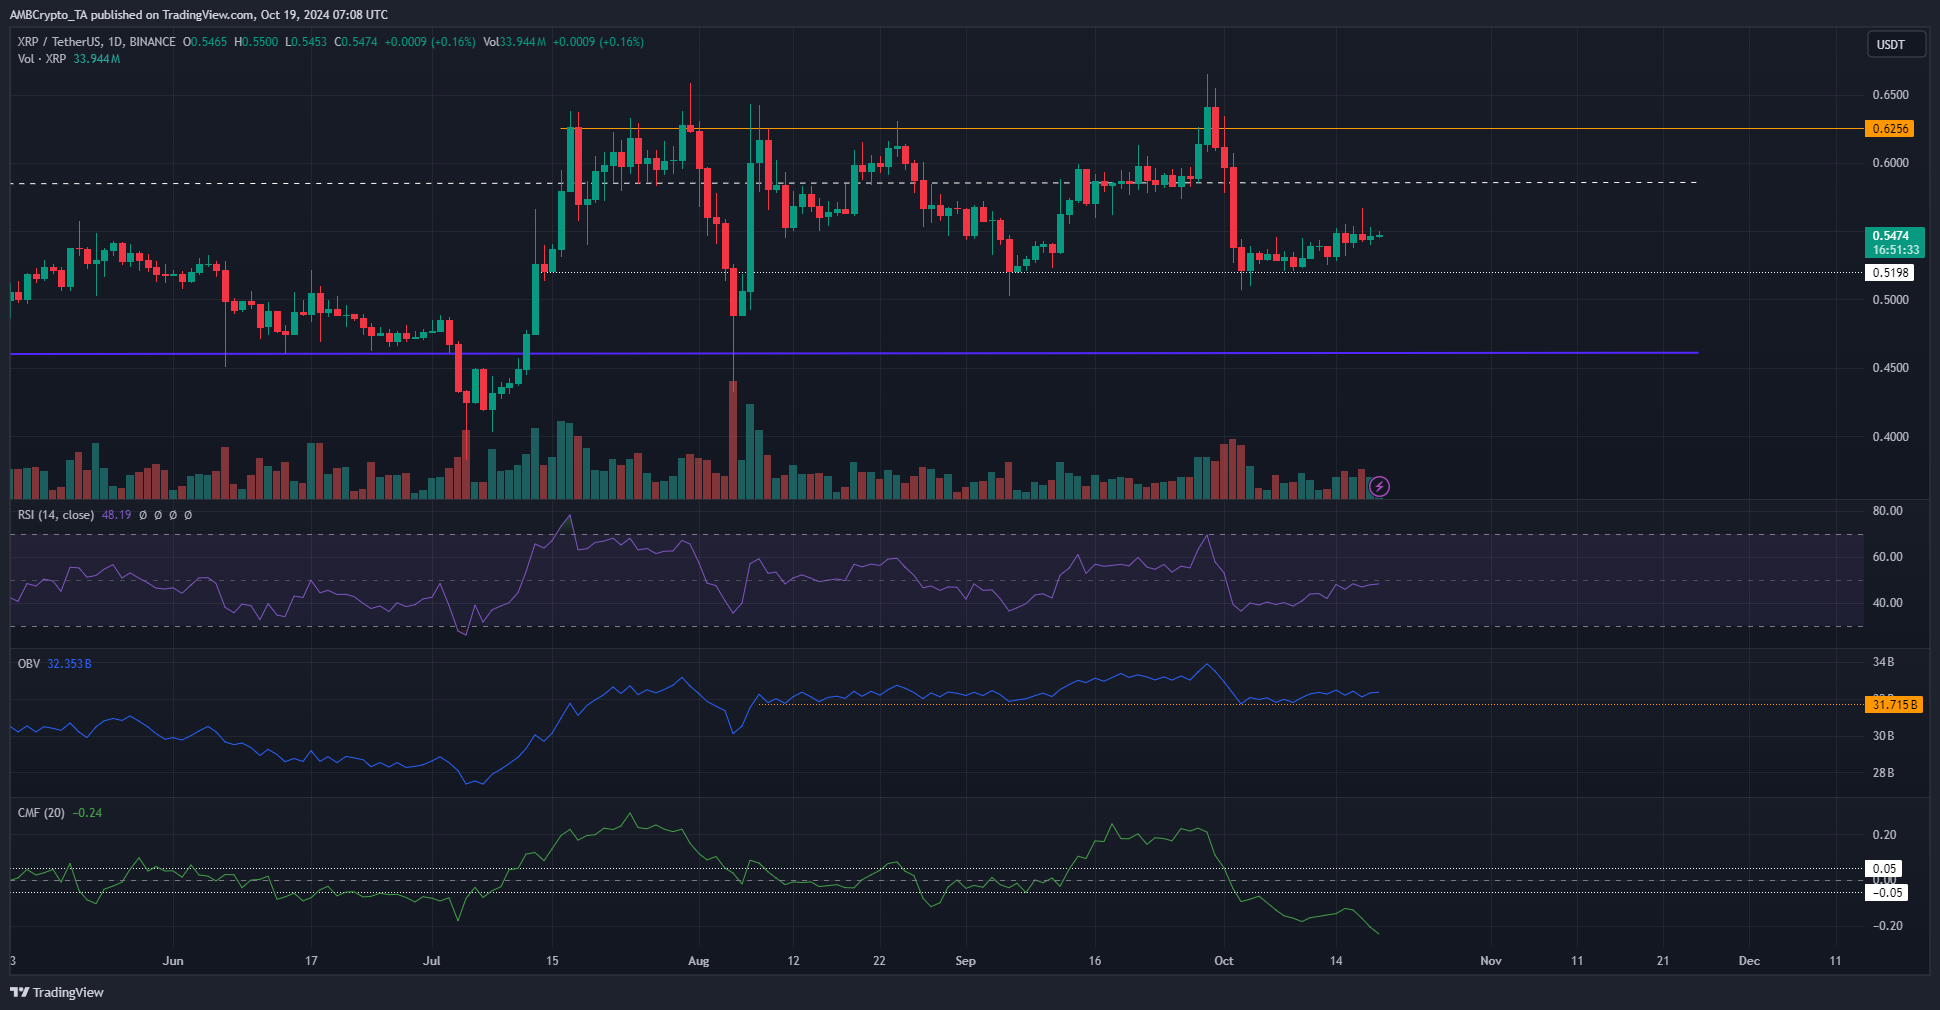
Source: XRP/USDT on TradingView
Despite XRP’s market structure leaning towards bullishness, the tight range between $0.52 and $0.62 diminishes its significance. The defense of the $0.52 level in October might have served as the trigger swing traders were waiting for to enter long positions.
October has seen a lack of strong buying volume, even with an 8% increase from XRP’s lows. The On-Balance Volume (OBV) reflected this trend, maintaining a support level established in August. The Chaikin Money Flow (CMF) indicated notable selling pressure over the last twenty periods, taking into account the sharp pullback from the $0.665 mark.
With the daily Relative Accumulation Index (RAI) just below the neutral 50, swing traders might consider going long based on the price movement, yet the demand remains absent. It is likely that other large-cap altcoins will outperform XRP in the near term.
Derivatives data did not favor the bullish scenario
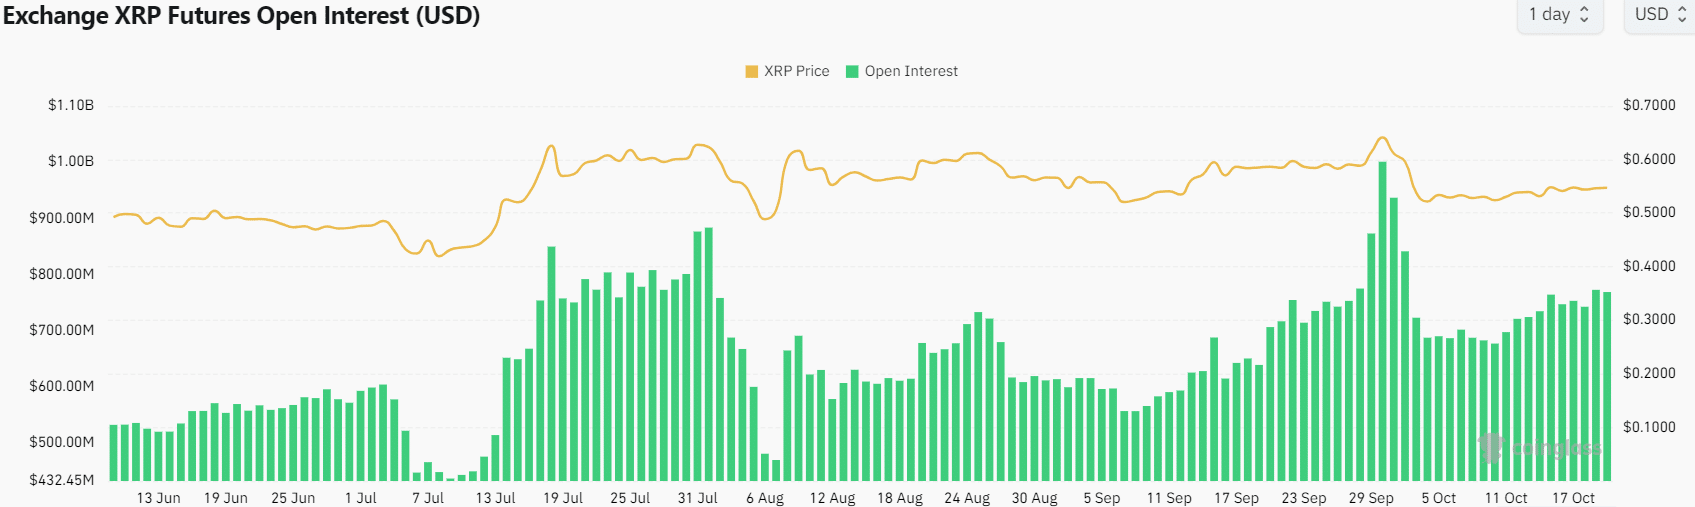
The Open Interest remained at $772 million, a level maintained for most of the time since July. A price movement beyond $0.62 could attract more speculative interest as it did in late September.
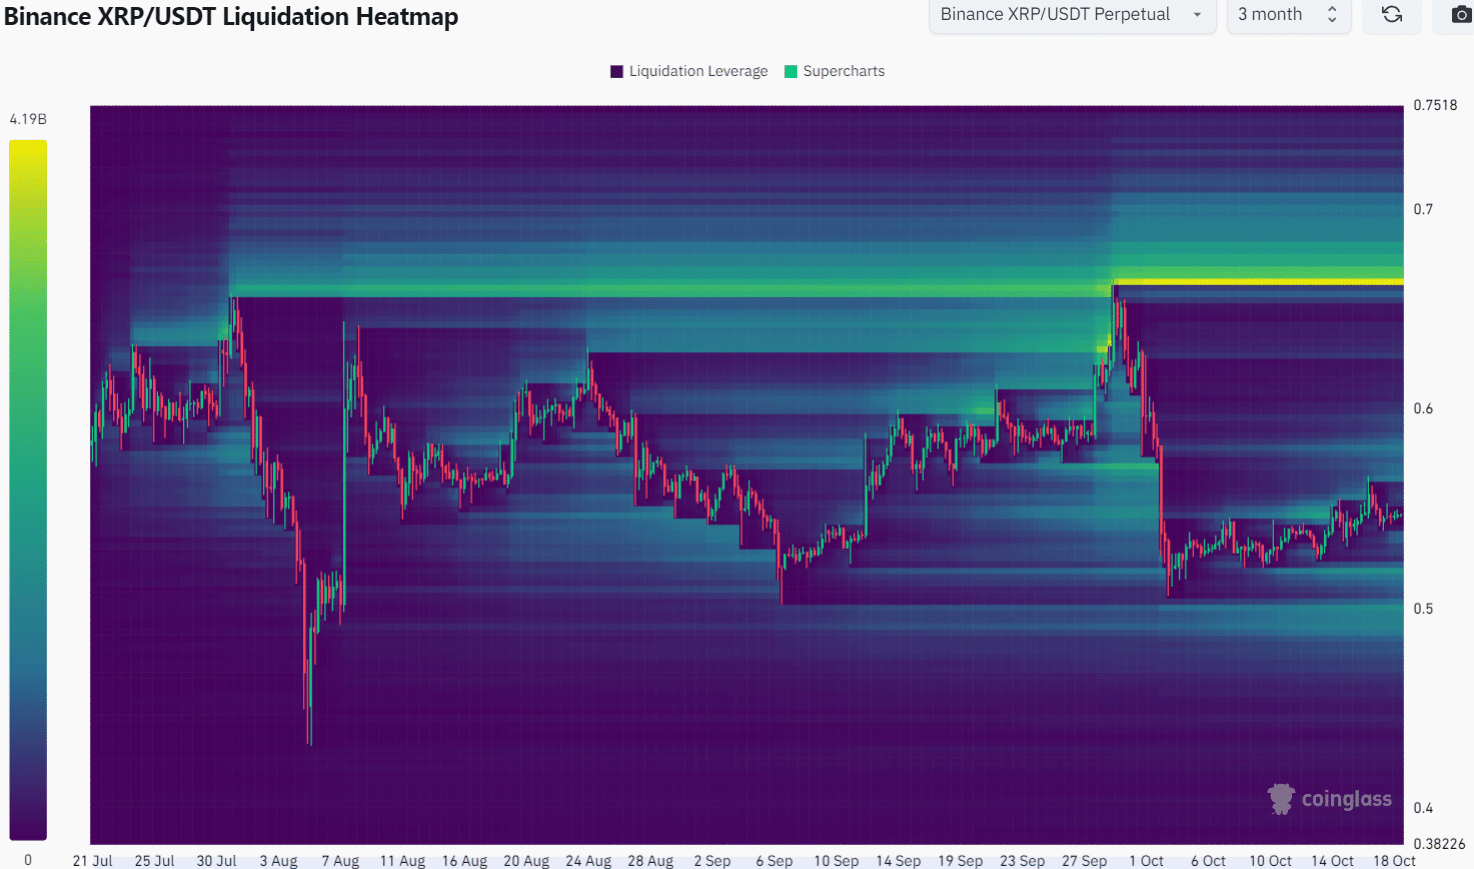
To witness a genuine breakout past the $0.62 resistance, a significant news event might be necessary. Indeed, the liquidation heatmap over the past three months indicates that $0.667 would be the next target should such a breakout occur.
Is your portfolio in the green? Check the Ripple Profit Calculator
Analyzing the lower timeframe heatmaps, it appears that the $0.52 and $0.57 levels could act as nearby magnetic zones, potentially causing short-term price trends to reverse.
Disclaimer: The information provided does not constitute financial, investment, trading, or any other form of advice and reflects solely the writer’s opinion


 Dutch
Dutch English
 French
 German
 Greek
Greek Italian
 Portuguese
 Russian
 Spanish