


The XRP price is currently hovering within a narrow range just below the $0.550 mark. To initiate a new upward trend, the price needs to surpass the $0.5450 and $0.5500 resistance levels.
- The XRP price remains confined within a range above the $0.5080 support level.
- The current trading price is around $0.5320, coinciding with the 100-hourly Simple Moving Average.
- A bearish trend line is forming with resistance at $0.5340 on the hourly chart for the XRP/USD pair (data sourced from Kraken).
- The pair may gain bullish momentum if it breaks through the $0.5360 and $0.5450 resistance levels.
XRP Price Looks for Fresh Upsurge
The XRP price has stayed above the $0.5080 support threshold. It has entered a consolidation phase above the $0.5120 level, in contrast to Bitcoin and Ethereum.
A slight upward movement was observed, with the price rising above the $0.5250 resistance level, and later surpassing $0.5320. However, sellers are active near the 50% Fibonacci retracement level of the downward wave from the $0.5453 swing high to the $0.5211 low.
Currently, the price is trading at approximately $0.5320, close to the 100-hourly Simple Moving Average. If there is a further increase, resistance might be met around the $0.5340 level. A bearish trend line is also forming with resistance at this level on the hourly XRP/USD chart.
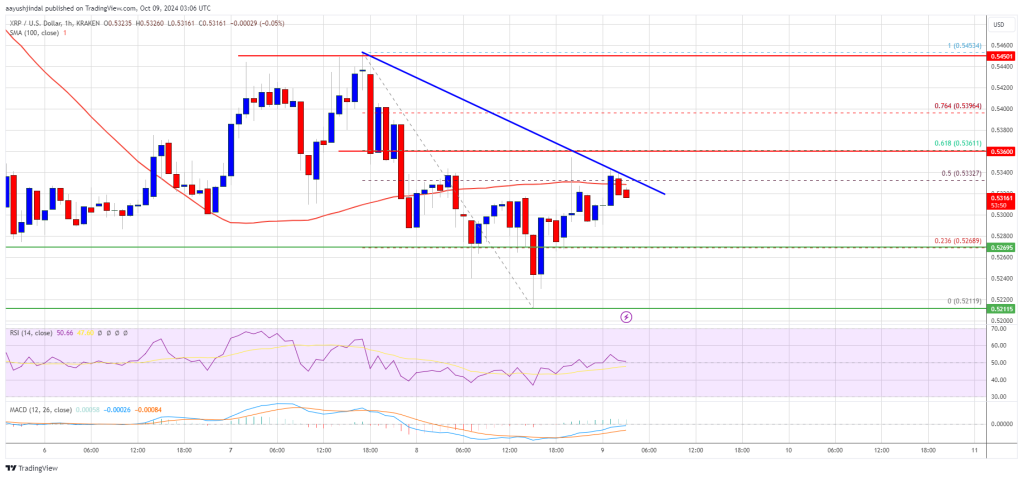
The primary resistance level is situated near $0.5460, which coincides with the 61.8% Fibonacci retracement level of the downward wave from $0.5453 to $0.5211. The next significant resistance may be at $0.5550. A decisive break above this level could propel the price toward $0.5800. Continued gains could then drive the price to test the $0.6000 resistance or even reach $0.6050 in the near future, with the next major barrier potentially at $0.6250.
Potential for Another Drop?
If XRP fails to overcome the $0.5360 resistance area, it may initiate another downturn. The initial support level on the downside is around $0.5200, followed by major support near the $0.5165 level.
A downward breach and a close below the $0.5165 level may allow the price to further decline towards the $0.5050 support level in the near term, with the next significant support located around the $0.5000 zone.
Technical Indicators
Hourly MACD – The MACD for XRP/USD is currently accelerating within the bullish zone.
Hourly RSI (Relative Strength Index) – The RSI for XRP/USD stands above the 50 threshold.
Major Support Levels – $0.5200 and $0.5165.
Major Resistance Levels – $0.5360 and $0.5450.


 Dutch
Dutch English
 French
 German
 Greek
Greek Italian
 Portuguese
 Russian
 Spanish