

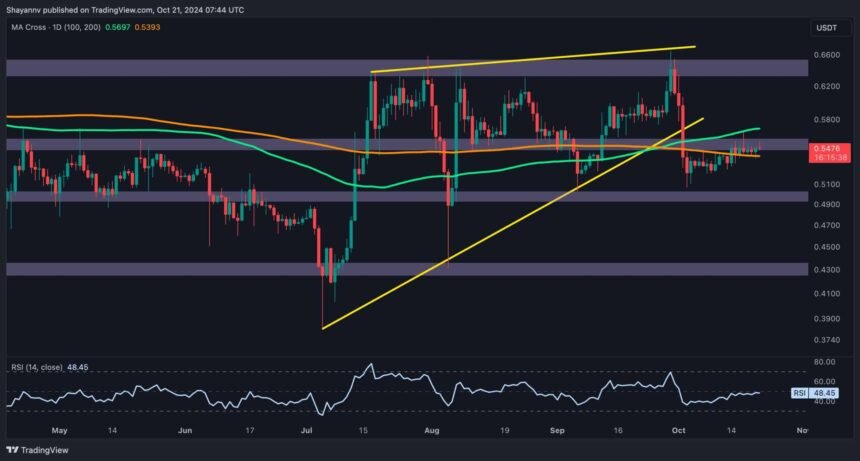
Ripple is currently undergoing a minor corrective consolidation phase following a significant drop towards the $0.5 area.
However, the asset encounters a crucial resistance zone, which might result in a rejection and a potential decline aimed at regaining the $0.5 support level.
XRP Analysis
By Shayan
The Daily Chart
Ripple’s price recently saw a considerable drop towards the $0.5 support level, a zone that has served as a reliable support for the asset over the past months. After reaching this key support area, XRP has entered a corrective consolidation phase, retracing towards the previously breached 100-day moving average at approximately $0.57.
This corrective period is marked by low trading activity and reduced volatility, which often indicates the potential end of a pullback. The 100-day moving average now stands as a vital dynamic resistance point. The pullback is likely to conclude if selling pressure intensifies at this level, leading to a rejection.
Ripple might continue its bearish trend, aiming for the $0.43 support area as its next long-term goal. On the other hand, a breakout above the 100-day MA could initiate a short liquidation event, possibly causing a rally towards $0.62.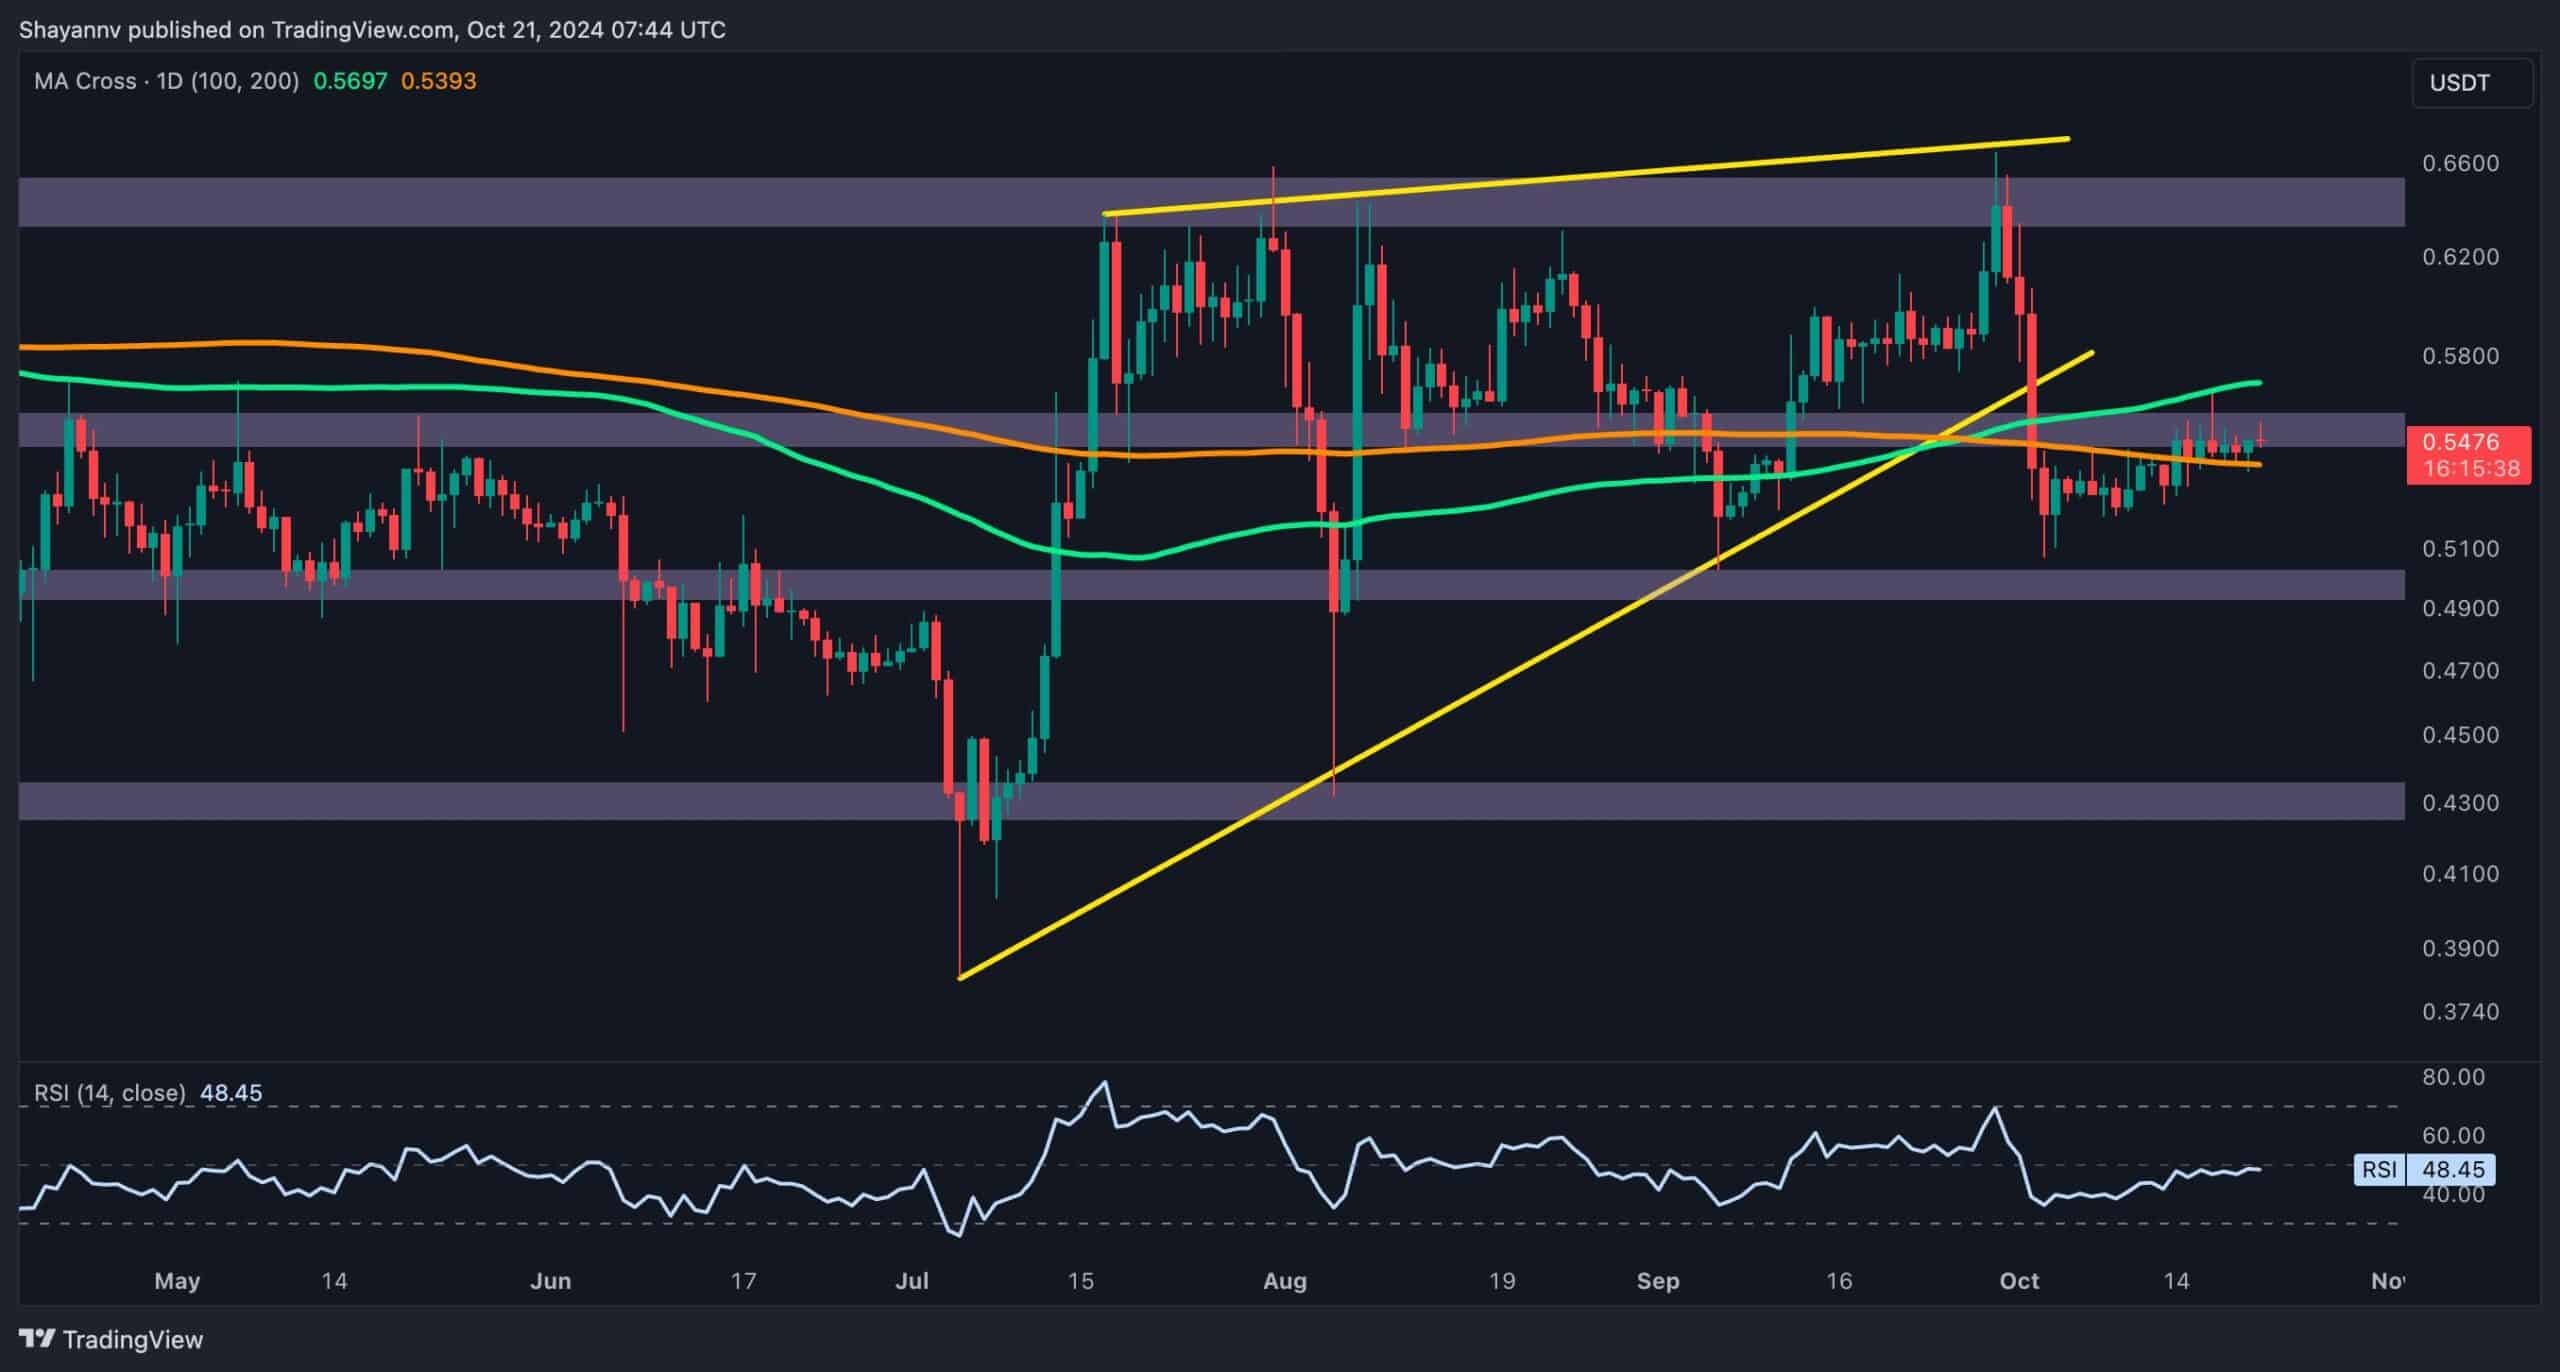
The 4-Hour Chart
On the 4-hour chart, Ripple’s recent downtrend found support at the 0.5 ($0.52) and 0.618 ($0.49) Fibonacci retracement levels—critical demand areas in recent times. This significant support region halted the descent, facilitating a minor consolidation towards the $0.56 resistance level.
At present, XRP is forming a bearish continuation flag pattern, indicating the possibility of further declines. If the price breaks below the flag’s lower boundary, sellers are likely to attempt to drive it below the 0.5 Fibonacci level ($0.52) to continue the downward trend. Conversely, a breakout above $0.56 could prompt short liquidations, resulting in a swift rally as traders close their short positions.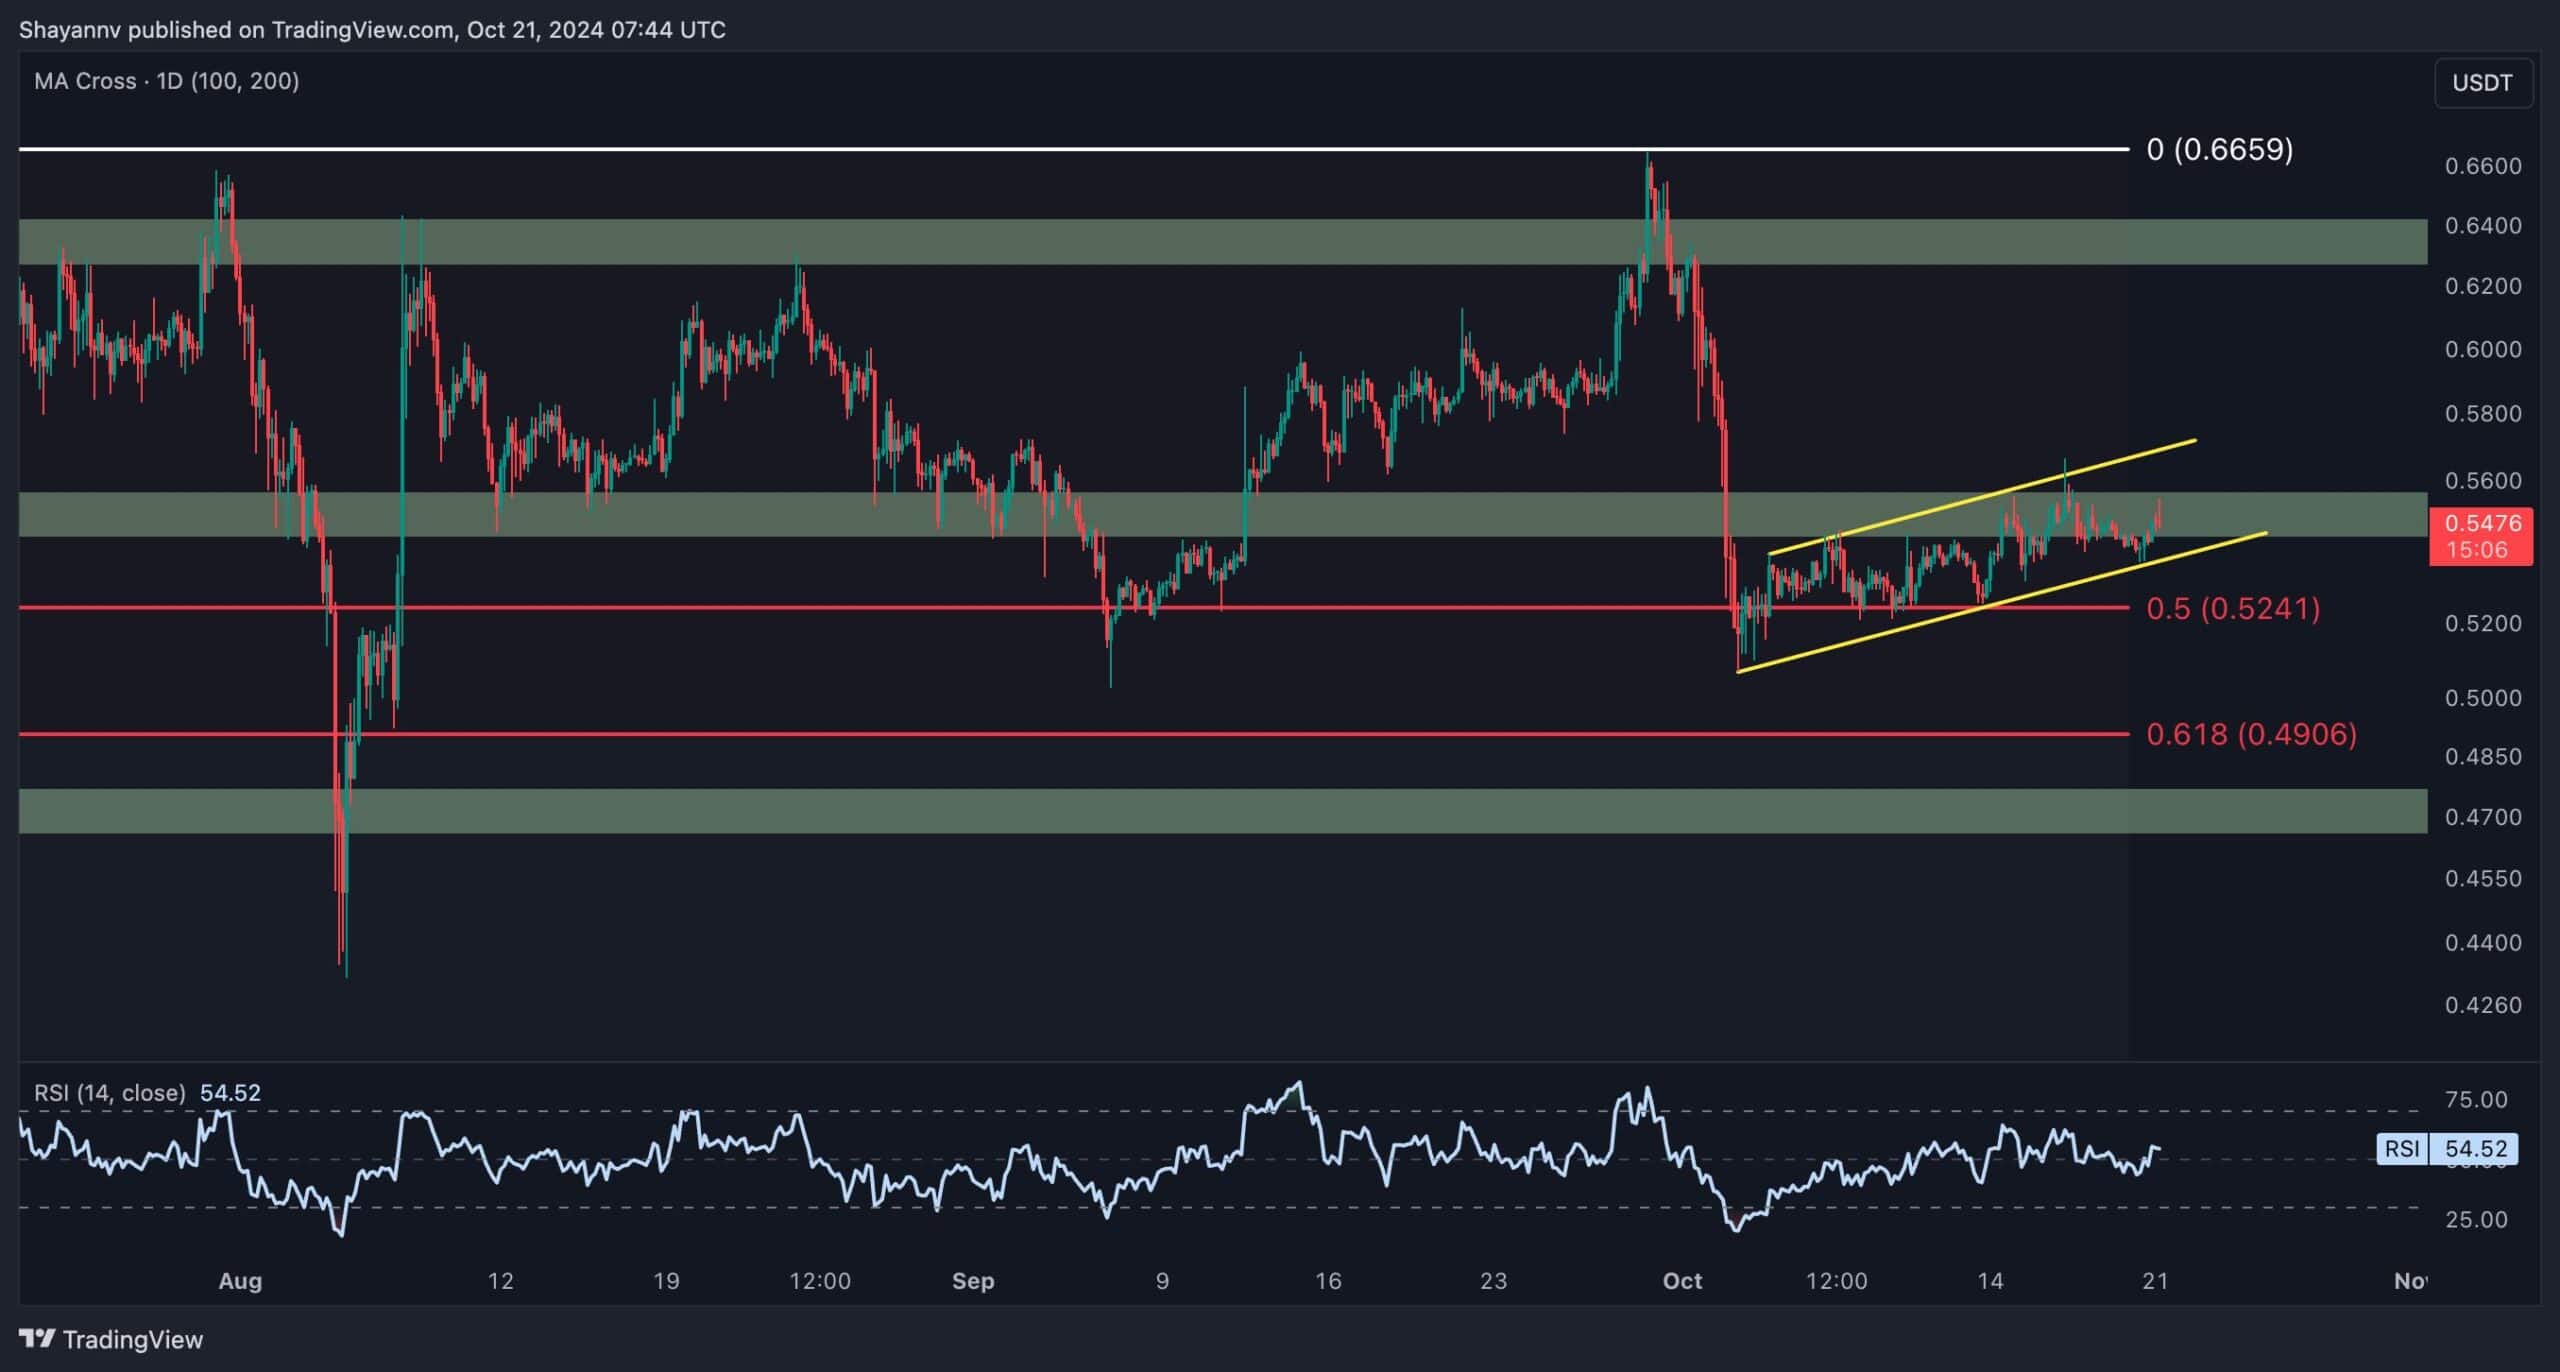
The post Ripple Price Analysis: This Is How XRP Can Avoid a Drop to $0.5 appeared first on CryptoPotato.


 Dutch
Dutch English
 French
 German
 Greek
Greek Italian
 Portuguese
 Russian
 Spanish