


The XRP price is currently undergoing a downward adjustment below the $0.650 mark. It is now hovering around the $0.6120 support level and may be poised for a potential rebound.
- The XRP price has initiated a pullback from the resistance area around $0.6650.
- The price is trading below $0.6450 and also the 100-hourly Simple Moving Average.
- A bearish trend line is forming, with resistance identified at $0.6350 on the hourly chart of the XRP/USD pair (data sourced from Kraken).
- If the pair surpasses the $0.6320 and $0.6350 resistance levels, it could embark on a fresh upward trend.
XRP Price Sets Sights on Renewed Upsurge
XRP price has built upon its gains above the $0.620 resistance, outperforming both Bitcoin and Ethereum. The price even surpassed the $0.650 threshold before sellers took action. A peak was reached at $0.6642, after which a downward correction began.
The price dipped below the $0.6450 and $0.6350 marks, reaching the $0.6100 area. A low of $0.6091 was recorded, and the price is now in a phase of consolidating losses, with a slight uptick above the $0.6200 level.
The price has risen past the 23.6% Fib retracement level of the decline from the $0.6642 high to the $0.6091 low. Currently, it is trading above $0.6150 and the 100-hourly Simple Moving Average. On the upside, resistance may be encountered around the $0.6320 level.
A bearish trend line is in place, showing resistance at $0.6350 on the hourly XRP/USD chart. This coincides closely with the 50% Fib retracement level from the decrease that started at $0.6642 and fell to $0.6091.
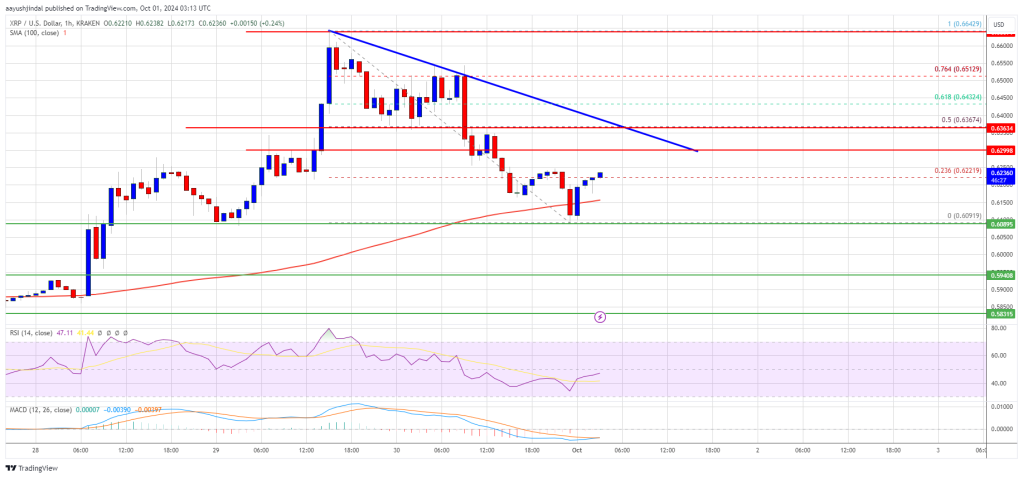
The primary resistance level to watch is around $0.6420. Following that, a crucial resistance level could be at $0.6500. A decisive breakout above the $0.6500 resistance might propel the price towards the $0.6640 mark. Sustained gains could potentially lead the price to $0.680 or even $0.700 in the short term.
Continuation of Decline?
Should XRP fail to breach the $0.6350 resistance area, it may continue to trend lower. Initial support on the downside is found around the $0.6150 level, with the next significant support at approximately $0.6080.
In the event of a breakdown and a close beneath the $0.6080 level, the price may further decline towards the $0.600 support level in the near term. A crucial support point is placed at $0.580.
Technical Indicators
Hourly MACD – The MACD indicator for XRP/USD is currently losing momentum within the bearish zone.
Hourly RSI (Relative Strength Index) – The RSI for XRP/USD is now situated below the 50 mark.
Key Support Levels – $0.6150 and $0.6080.
Key Resistance Levels – $0.6320 and $0.6350.


 Dutch
Dutch English
 French
 German
 Greek
Greek Italian
 Portuguese
 Russian
 Spanish