WIF is demonstrating remarkable strength as bullish momentum takes charge, with the Relative Strength Index (RSI) indicating even more upward potential. The current RSI reading highlights sustained buying pressure, boosting optimism for ongoing gains. As bulls maintain their stance, confidence is growing that WIF could be on the verge of a significant breakout towards the $2.8 level.
With market sentiment shifting positively, this article will delve into the bullish supremacy in WIF, concentrating on how the RSI points toward promising upside potential. By evaluating key technical indicators and market trends, we aim to determine if WIF can sustain its upward trajectory and successfully breach upcoming resistance levels.
Strengthening Bullish Sentiment: Is WIF Set to Break $2.6?
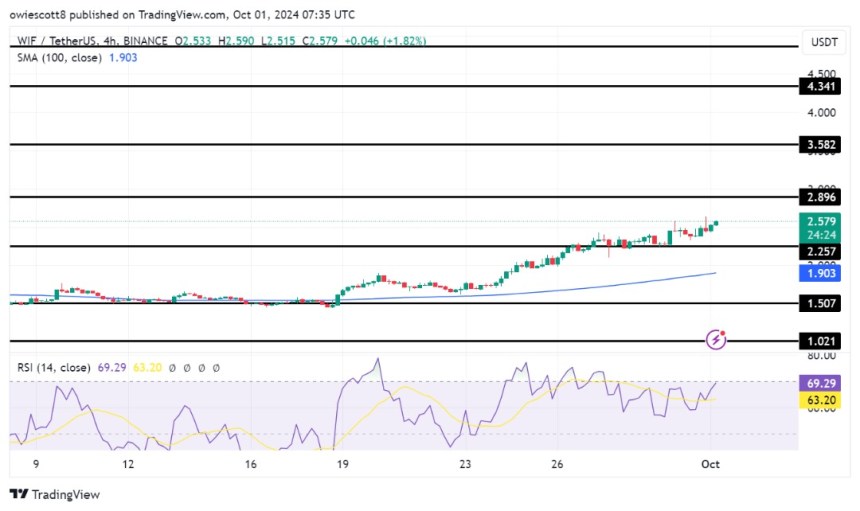
On the 4-hour chart, WIF has shown strong bullish momentum following a successful breach of the $2.2 mark. This upward movement has propelled the price nearer to the $2.8 resistance level, laying the groundwork for a potential breakout.
As bulls continue to assert dominance, this resistance level becomes a crucial obstacle. A decisive rally above $2.8 could pave the way for additional gains, drawing in more buying interest and potentially resulting in new highs.

Examining the 4-hour Relative Strength Index (RSI) reveals renewed potential for upward movement, as the RSI climbs back to the 68% level after dipping to 62%. Should the RSI persist in rising, WIF may advance further, likely breaking through essential resistance levels.
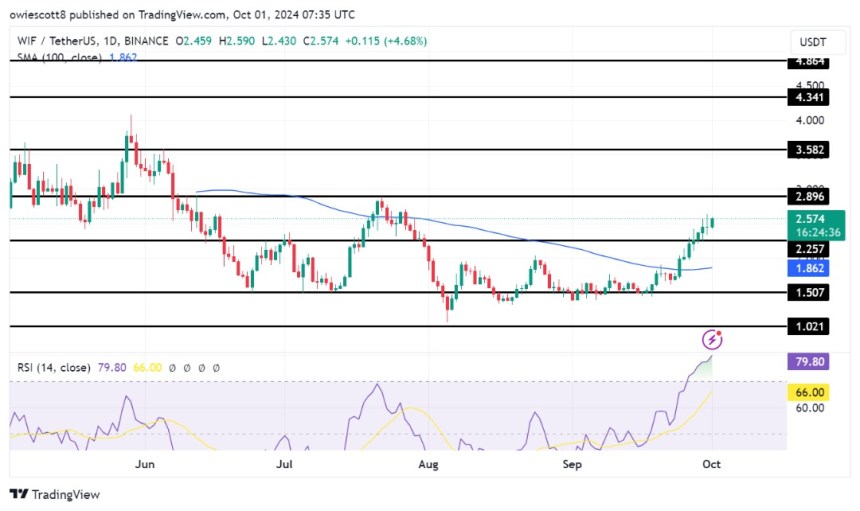
Moreover, WIF has successfully exceeded the 100-day Simple Moving Average (SMA) and the $2.2 level on the daily chart, signifying a meaningful shift in its price momentum. By maintaining levels above these critical thresholds, the asset showcases its strength and solidifies a bullish outlook. This positive trajectory is not merely a temporary blip; it reflects significant buying interest and enhanced market confidence, indicating that WIF is poised for additional gains soon.

The Relative Strength Index (RSI) on the daily chart currently stands at 79%, showing no imminent signs of decline. This elevated RSI level indicates that WIF is in overbought territory, reflecting strong buying pressure and heightened market enthusiasm. While high readings may suggest potential exhaustion in upward movement, the lack of immediate signals for a pullback implies that bullish sentiment remains strong.
Short-Term Expectations for the Meme Coin
Currently, WIF is exhibiting strong positive movement, prompting traders and investors to keep an eye on key levels for possible price fluctuations. Sustaining its position above the 100-day Simple Moving Average (SMA) and the $2.2 mark could result in further gains, with the $2.6 resistance level in sight. A successful breakout above $2.6 may unleash additional price growth and bolster traders’ optimism, indicating a more sustained upward trend.
Nonetheless, with the Relative Strength Index signaling overbought conditions at 79%, a price correction may occur if buying pressure diminishes, leading WIF’s price to potentially retrace toward the $2.2 level for a retest.


