


In this article, we explore the 20 most frequently encountered cryptocurrency chart patterns and their implications.
What are Chart Patterns?
A chart pattern is a distinctive shape on a price chart that offers insights about the next potential price movement by analyzing historical price actions. Chart patterns form the foundation of technical analysis, assisting traders in predicting the likely direction of future price trends.
Interpreting chart patterns has been part of trading practices for a long time, even before the cryptocurrency sector emerged.
The patterns presented and represented in this article are not novel; they stem from techniques in technical analysis established in the early 20th century and correspond to familiar patterns and terminology used in both stock and Forex markets today.
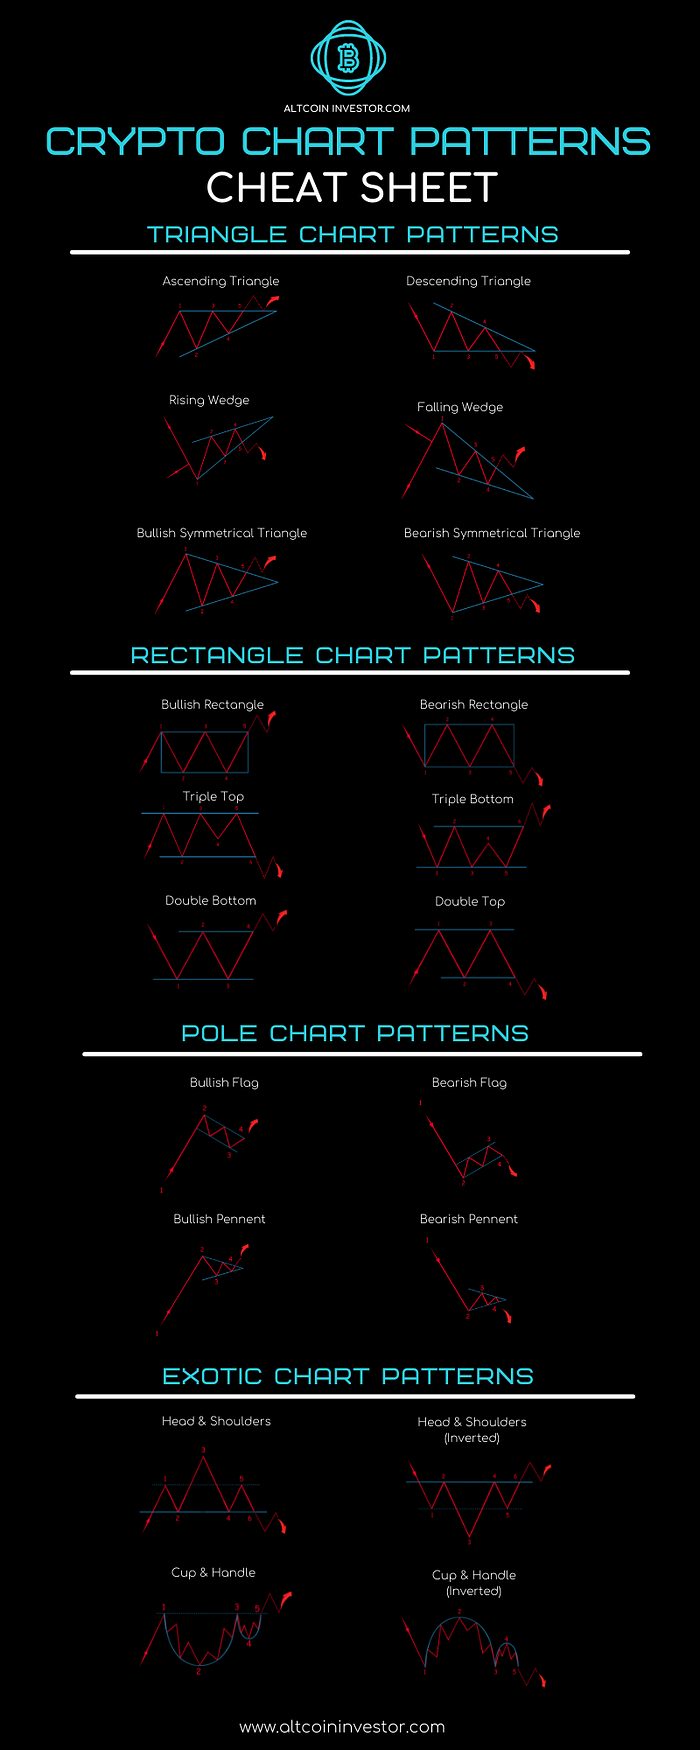
Top 20 Crypto Chart Patterns:
While 20 patterns may seem extensive, they consist of only 10 distinct patterns (as the remaining are inverses).
These twenty trading patterns are divided into four categories:
- Triangle Chart Patterns (6)
- Rectangle Chart Patterns (6)
- Pole Chart Patterns (4)
- Exotic Chart Patterns (4)
TRIANGLE CHART PATTERNS (6)
There are six patterns classified under triangle patterns, with half being their inverted versions.
Ascending Triangle
This pattern signals a bullish market and suggests the continuation of an upward trend. The ascending triangle is a frequently observed pattern in rising markets.

During an upward trend, the initial resistance is encountered (1), and price retraces until identifying the first support (2). The price changes direction and continues its rise until meeting the second resistance (3), which aligns with or is similar to the first resistance level, forming the horizontal line of the pattern.
Price then reverses and establishes support slightly above the previous level (4).
The pattern concludes when the price breaks through the original resistance level as outlined in this pattern (5).
Descending Triangle
This pattern indicates a bearish market and suggests the continuation of a downward trend. It acts as the inverse of the ascending triangle.
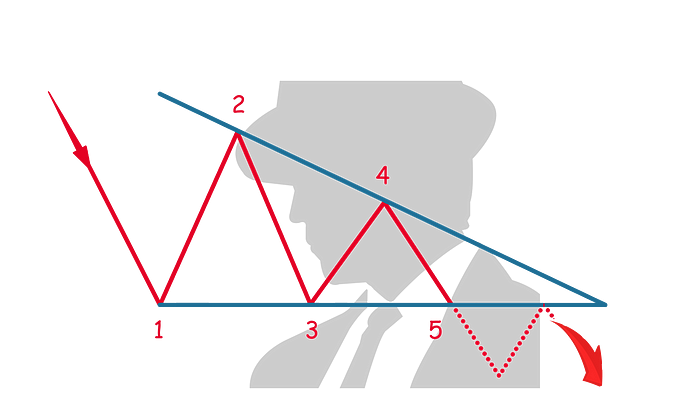
In a downtrend, the first resistance is found (1), establishing the horizontal resistance for the subsequent price movement. The price reverses and determines its first support (2), which stands as the highest point in this formation.
The price moves back and finds its second support (3), approximately at the same level as the first resistance (1). The price then reverses again, hitting a lower resistance level (4), forming the downward slope of the triangle.
Completion occurs when the price reverses once more and breaches the established horizontal line at (5).
Bullish Symmetrical Triangle
This pattern is a bullish indication, signifying a continuation of the upward trend. The bullish symmetrical triangle is widely recognized in ascendant markets.

In an upward trend, the price identifies its first resistance (1), which serves as the peak price in the pattern. The price retracts and establishes its first support (2), the lowest point within this pattern. The price then rallies from the first support (2) to form a second resistance (3), lower than the first. These two resistance levels create the downward slope of the symmetrical triangle.
The subsequent support level (4) is above the first support (2), forming the upward slope of the symmetrical triangle.
The pattern concludes when the price moves from the second support (4) and breaks above the triangle’s upper boundary (5).
Bearish Symmetrical Triangle
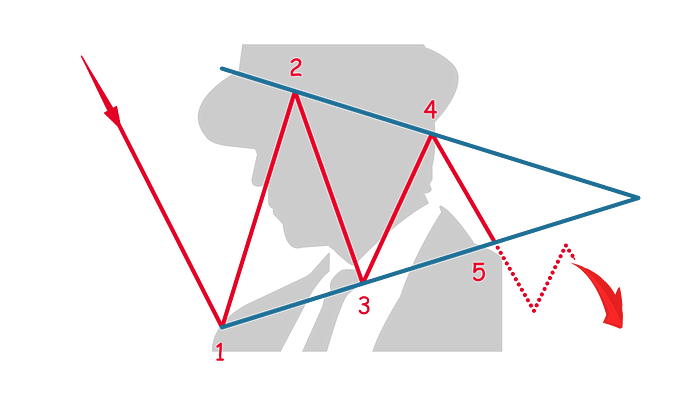
In a downtrend, the price establishes its first support (1), which signifies the lowest price in this pattern. The price traces back to find its first resistance (2), which serves as the peak point in the pattern.
The second support (3) exceeds the first support (1), creating an upward slope for this formation. The price then reverses direction, and the second resistance (4) is lower than the first resistance (2), establishing the downward angle of the pattern.
Completion is reached when the price moves past the lower angle of the pattern (5), anticipating a lower low and a bearish trend.
Rising Wedge
The rising wedge serves as a bearish indicator and may appear in both uptrends and downtrends. It is not a frequently seen pattern.

In either trend, the first point in this pattern (1) establishes the initial support and also marks the lowest point in the pattern. As the price retraces, the first resistance level (2) is established, representing the lowest resistance in this formation.
When the price begins to retrace again, the second support (3) is determined, and both the first (1) and the second (3) supports create the bottom angle of the rising wedge.
The price continues to reverse, reaching a second resistance (4) above the first resistance (2).
This pattern concludes when the price reverses (4) and breaches the bottom of the rising wedge (5).
Falling Wedge
The falling wedge functions as a bullish indicator and can be identified in both uptrends and downtrends. The falling wedge is less common and is essentially the inverse of the rising wedge.

This pattern can be developed after either an upward or downward trend, where the first resistance (1) represents the highest point in the pattern. The price subsequently reverses and meets its first support (2), marking the highest support within this setup.
The price then retraces upward to reach the second resistance level (3), lower than the first (1). These two points mark the upper angle of the falling wedge.
As the price reverses again, it discovers the second support (4), which is lower than the initial support level (2), thus establishing the bottom angle of the falling wedge.
Completion occurs when the third resistance level (5) is broken, surpassing the upper angle of the falling wedge.
RECTANGLE CHART PATTERNS (6)
Six patterns fall under the rectangle chart patterns category, with half being inverted versions.
Bullish Rectangle
This common pattern signals the continuation of an upward trend.

In an upward trend, the price meets its first resistance level (1), creating a horizontal line that will indicate the resistance for the remainder of this pattern.
As price retraces, it discovers its first support level (2), forming another horizontal line which will serve as the support level throughout this formation.
As the price progresses upward from the first support (2), it identifies the second resistance level (3), placed at or around the same level as the first resistance.
The price then retracts, discovering support (4) near the level of the first support.
Completion of the pattern occurs when the price alters direction and breaks through the upper limit of the pattern (5).
Bearish Rectangle
This pattern is quite typical, indicating the continuation of a downward trend. It is the inverse of the bullish rectangle.
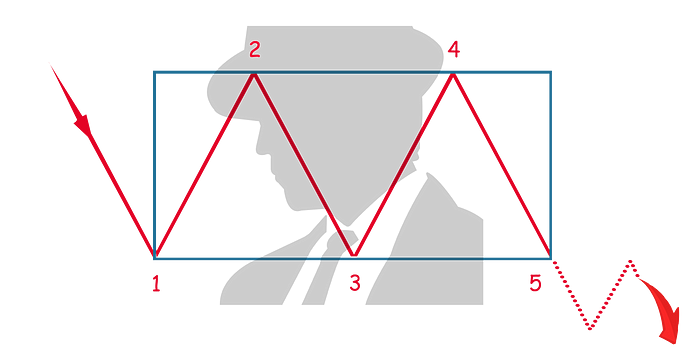
In a downtrend, the price finds its first support (1), establishing a horizontal line that will denote support for the rest of the pattern.
The price then reverses to find its first resistance (2), forming a horizontal line that will also represent the resistance for the subsequent pattern.
The price continues downward until it encounters the second support level (3), situated around the same level of support as the first (1).
It reverses direction, moving upward until encountering the second resistance level (4), which aligns closely with the initial resistance (2).
Completion is marked when the price retraces downward and breaks the lower edge of the pattern (5).
Double Top
A double top is a prevalent pattern that indicates a price direction reversal.
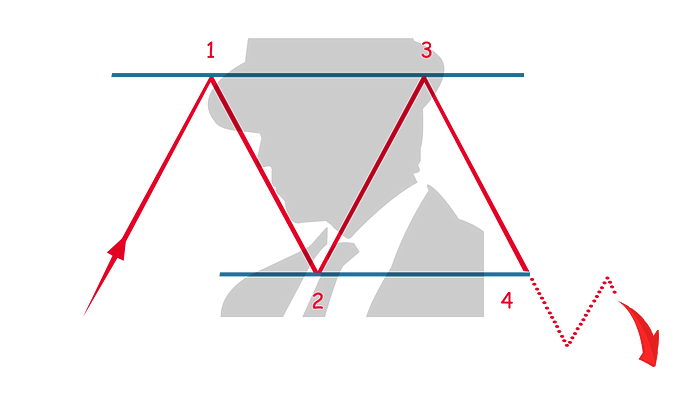
During an uptrend, the price identifies its first resistance (1), creating a horizontal line that becomes the resistance level for the remainder of the pattern.
The price then retraces to find its first support (3), establishing a horizontal line that will be the support level for the rest of the pattern.
As the price reverses and ascends, it reaches the second resistance (3), which aligns closely with the initial resistance (1).
This pattern concludes when the price changes direction, declining until it breaks the support level established in the pattern (4).
Double Bottom
The double bottom is a familiar pattern that signals a price direction reversal and is the inverse of the double top.

In a downtrend, the price finds its first resistance level (1), forming a horizontal line that will serve as the support level throughout the pattern.
The price subsequently reverses and encounters its first resistance (2), which establishes a horizontal line that signifies the resistance level for the rest of the pattern.
As the price reverses and descends, it discovers the second support (3), aligned closely with the first support (1).
The pattern is completed when the price reverses upward until it breaks the resistance level established in the chart (4).
Triple Top
A triple top acts as a bearish indicator and is less commonly seen, indicating a price direction change.
During an uptrend, the price identifies its first resistance (1), which creates a horizontal line that signifies the resistance for the ongoing pattern.
The price then retraces to find its first support (2), establishing a line that denotes the support level throughout the pattern.
As the price retraces and goes upward, it identifies the second resistance (3) approximating the level of the initial resistance (1).
The price then retraces again to find the second support (4), which might be higher or lower than the initial support (2).
Price movement then reverses, rising until it reaches the resistance level (5), matching the initial resistance (1).
This pattern is completed when the price alters direction, moving downward until it breaches the established support level in the pattern (6).
Triple Bottom
A triple bottom functions as a bullish indicator and is a lesser-known pattern, indicating a price reversal. It serves as the inverse of the triple top.

In a downtrend, the price finds its first support (1), forming a horizontal line to denote the support level for the ongoing pattern.
Price then reverses, identifying its first resistance (2), establishing a horizontal line that marks the resistance level for the remaining pattern.
As the price descends, it finds the second support (3), which is at a similar level to the first support (1).
The price then reverses again, determining the second resistance (4), which may be higher or lower than the first resistance (2).
Completion is marked when the price moves upward until it breaks through the resistance level indicated in the pattern (6).
POLE CHART PATTERNS (4)
This category comprises four patterns, with half being inverted versions.
Bullish Flag
The bullish flag is a widely recognized bullish indicator and a common pattern.

During a sharp and prolonged upward trend, the price identifies its first resistance (2), establishing the flagpole of this pattern.
As the price retraces sharply, a flag-like formation emerges, characterized by lower highs and lower lows until a support level (3) is established.
This pattern concludes when the price alters direction, moving upwards and breaking out of the flag-like formation (4).
Bearish Flag
The bearish flag is a well-known bearish indicator and a frequent pattern. It serves as the inverse of the bullish flag.
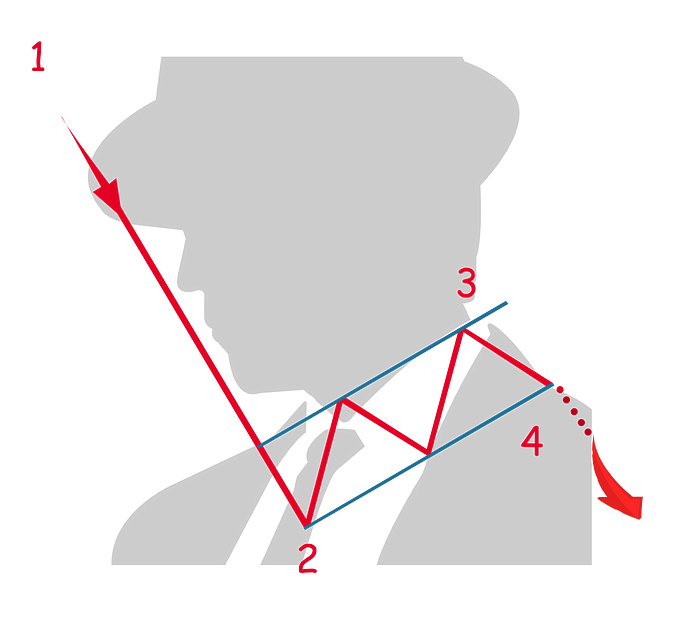
Within a persistent downward trend, the price locates its first support (2), forming the inverted pole of this pattern.
As the price retraces, a flag-like formation emerges, characterized by higher lows and higher highs until reaching the maximum resistance level (3).
This pattern concludes when the price alters direction, moving downward until it breaks through the flag-like formation (4).
Bullish Pennant
The bullish pennant serves as a widely recognized bullish indicator and is a prevalent pattern.
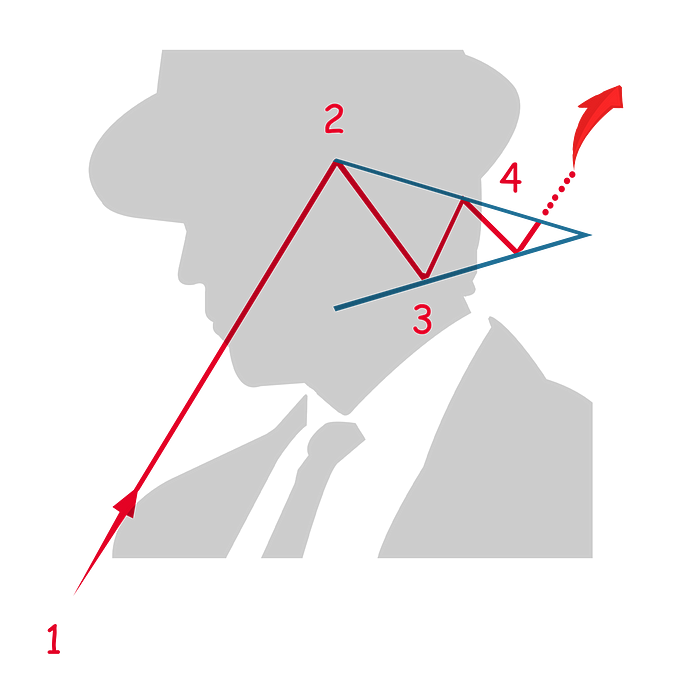
In a sharp upward trend, the price identifies its first resistance (2), which forms the pole of the pennant.
As the price retracts slightly, it finds its first support level (3).
Over brief price movements, a pennant-like configuration arises, distinguished by lower highs and higher lows in a narrow pennant-like formation.
Completion occurs when the price reverses direction, moving upward and breaking out of the upper section of the pennant (4).
Bearish Pennant
The bearish pennant is a noted bearish indicator and a commonly observed pattern, serving as the inverse of the bullish pennant.

In a sustained downward trend, the price locates its first support (2), establishing the pole of the pennant.
As the price reverses, it finds its first resistance level (3).
Subsequent brief price movements produce a pennant-like structure, characterized by lower highs and higher lows in a narrow pennant shape.
The pattern is completed when the price changes direction, trending downward until breaking out of the lower portion of the pennant formation (4).
EXOTIC CHART PATTERNS (4)
This collection features less common patterns that do not neatly fit into the previously mentioned categories.
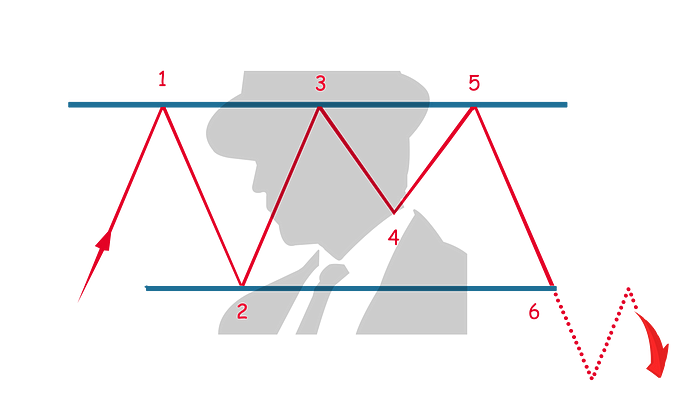
Head & Shoulders
The head and shoulders pattern signals a bearish trend and implies a change in price direction. It is not commonly encountered.

In an upward trend, the price finds its first resistance (1), creating the left shoulder of the pattern.
As it retraces slightly, the price identifies its first support level (2), completing the left shoulder’s formation.
The price then rises, establishing a second resistance (3), which has to exceed the first resistance (1) to form the head.
The price subsequently retraces until it reaches the second support (4), approximately equal to the first support level (2), marking the completion of the head formation.
The price ascends again to find a second resistance (5), near the level of the first resistance (1), creating the right shoulder of the pattern.
The pattern finalizes when the price retraces, moving downward until it breaks below the lower part of the right shoulder (6).
Head & Shoulders Inverted
The inverted head and shoulders, as suggested by its name, represents an inverted form of the head and shoulders pattern. It indicates a bullish reversal and is relatively uncommon.
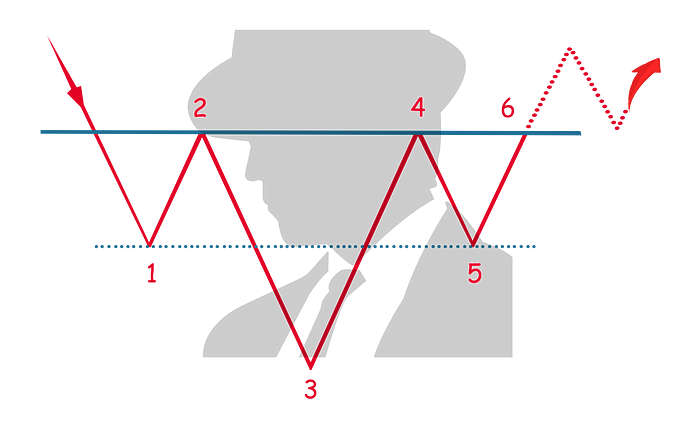
During a downtrend, the price encounters its first support (1), which becomes the left shoulder of the pattern.
As it reverses slightly, the price finds its first resistance level (2), forming the (inverted) left shoulder.
The price reverses and moves downward to locate a second support (3), forming the (inverted) head, which must be lower than the first support (1).
As the price retraces, it finds its second resistance (4), similar to the price of the first resistance (2), completing the (inverted) head formation.
The price lowers again, reaching the second support (5), which mirrors the price of the first support (1), thus forming the (inverted) right shoulder of the pattern.
Completion occurs when the price alters direction, moving upward until it surpasses the upper section of the (inverted) right shoulder pattern (6).
Cup & Handle
The cup and handle pattern signifies a continuation in market behavior and serves as a bullish signal. It is not frequently encountered.
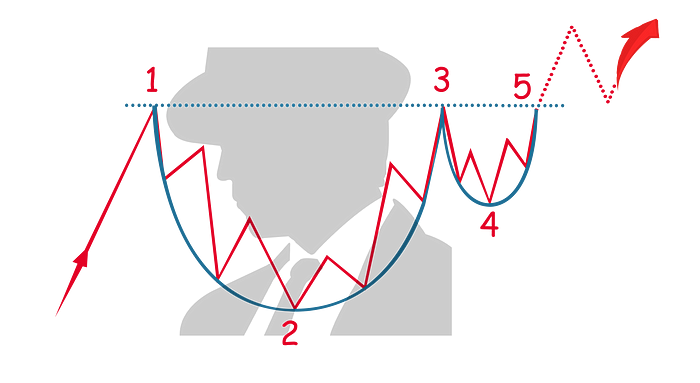
In an upward trend, the price locates its first resistance (1), forming the edge of the cup. After a reversal, the price finds its low point (2), establishing the base of the cup through minor price movements and retraces.
The price then rises, eventually reaching a second resistance (3), which is nearly aligned with the first resistance level (1), completing the cup structure.
The handle forms when the price retraces to find its support level (4), which exceeds the previous support level (2).
This pattern concludes when the price changes direction, moving upward (5) and breaking through the cup and handle structure.
Cup & Handle Inverted
This inverted cup and handle pattern, as indicated by its name, serves as the inverse of the standard cup and handle pattern. This pattern suggests a continuation and acts as a bearish signal; it is not often seen.

Diving into a downtrend, the price establishes its first support (1), forming the edge of the (inverted) cup. Following a price reversal, the price identifies its resistance level (2), marking the highest point within the inverted cup.
The subsequent reversal leads the price to discover its second support (3), which closely mirrors the first support level (1), concluding the inverted cup.
The handle formation emerges when the price navigates upwards until locating its resistance (4), which is beneath the earlier resistance level (2).
Completion occurs as the price shifts direction, moving downward (5) and surpassing the lower edge of the (inverted) cup and handle setup.
Download the Cheat Sheet:
For quick reference, a high-resolution infographic is available.
Get your own copy and download the cheat sheet here
Utilizing Chart Patterns & Technical Analysis
Chart patterns and technical analysis tools are vital components in analyzing cryptocurrencies and other financial assets. They empower investors and traders to make well-informed decisions by revealing insights into market dynamics.
Here’s how they are applied in cryptocurrency investing:
Understanding Market Sentiment:
- Chart patterns reflect the collective psychological mindset of market participants, crucial for comprehending market trends. For instance, formations such as Head and Shoulders or Double Top/Bottom may indicate a trend reversal, mirroring shifts in market sentiment.
Trend Identification:
- Recognizing the current trend is fundamental in technical analysis. Patterns like flags and pennants, and indicators such as Moving Averages help assess whether a cryptocurrency is following an uptrend, downtrend, or a sideways pattern.
Support and Resistance Levels:
- Both chart patterns and technical indicators assist in pinpointing support and resistance levels, crucial for determining entry and exit points. For example, a breakout above a resistance level may suggest a forthcoming bullish trend.
Predicting Future Price Movements:
- By examining historical price data, traders can employ chart patterns and technical indicators to forecast future price shifts.
Volume Analysis:
- Volume indicators offer insights into the strength or weakness of price fluctuations. A price change accompanied by high volume might indicate a robust trend, which can be validated with other indicators or chart patterns.
Risk Management:
- By identifying potential reversal points and trend strengths, investors can implement stop-loss and take-profit levels, essential for managing risks in the volatile crypto marketplace.
Enhancing Trading Strategies:
- Integrating chart patterns with technical indicators can enhance trading strategies. A combination of trend indicators with chart patterns may deliver a more comprehensive understanding of market conditions.
Confirmation:
- Utilizing both chart patterns and technical indicators can yield confirmation for trade setups. For instance, a bullish chart pattern in conjunction with a bullish crossover in Moving Averages can provide stronger validation for a long position.
Historical Performance Analysis:
- Technical analysis facilitates the assessment of historical performance, which aids in refining trading strategies for enhanced effectiveness in the crypto market.
Comparative Analysis:
- Engaging in comparative analysis of various cryptocurrencies or altcoins through technical review can enhance asset allocation and promote diversification.
To summarize, chart patterns and technical indicators, when employed effectively, offer a solid framework for navigating the intricacies of the cryptocurrency market, supporting better decision-making and potentially yielding more lucrative trading strategies.
You May Also Like:
What is Technical Analysis & Why YOU Should Know It!
Technical Analysis is a method for assessing crypto assets and forecasting their future trends.

Top “Technical Indicators” for Crypto – MUST READ!
Technical indicators employ mathematical calculations based on the price, volume, or open interest of a financial asset.

 Crypto Cashflow: 10 Ways to Expand Your Crypto Empire
From Holding to High Yield: Top 10 strategies for enhancing your crypto assets.


 Dutch
Dutch English
 French
 German
 Greek
Greek Italian
 Portuguese
 Russian
 Spanish