By using this site, you agree to the Privacy Policy and Terms of Use.
Accept
KriptotekaKriptoteka
  • Home
  • News
    • Web3
    • Crypto News
    • Market Analysis
  • Market
    • AI
    • Altcoins
    • Bitcoin
    • Blockchain
    • CEX
    • Defi
    • DePIN
    • DEX
    • ETFs
    • Ethereum
    • Gaming
    • ICO/IDO
    • Institutions
    • L1&L2
    • Meme
    • NFT tech
    • RWA
    • Stable coins
  • Data
  • Events
  • Learn
  • Reports
  • Podcasts
  • Pro membership
Reading: SUI’s RSI Declines: Bearish Signals Suggest More Downside Ahead
Share
Notification Show More
Font ResizerAa
Font ResizerAa
KriptotekaKriptoteka
  • Home
  • News
  • Market
  • Data
  • Events
  • Learn
  • Reports
  • Podcasts
  • Pro membership
  • Home
  • News
    • Web3
    • Crypto News
    • Market Analysis
  • Market
    • AI
    • Altcoins
    • Bitcoin
    • Blockchain
    • CEX
    • Defi
    • DePIN
    • DEX
    • ETFs
    • Ethereum
    • Gaming
    • ICO/IDO
    • Institutions
    • L1&L2
    • Meme
    • NFT tech
    • RWA
    • Stable coins
  • Data
  • Events
  • Learn
  • Reports
  • Podcasts
  • Pro membership
Have an existing account? Sign In
Follow US
  • Advertise
© 2022 Foxiz News Network. Ruby Design Company. All Rights Reserved.
Kriptoteka > Crypto News > SUI’s RSI Declines: Bearish Signals Suggest More Downside Ahead
Crypto News

SUI’s RSI Declines: Bearish Signals Suggest More Downside Ahead

marcel.mihalic@gmail.com
Last updated: October 26, 2024 2:52 pm
By marcel.mihalic@gmail.com 3 Min Read
Share
SHARE

As SUI continues its descent into bearish territory, technical indicators are increasingly pointing to a tough road ahead. The Relative Strength Index (RSI), a key metric, has turned negative, indicating a rise in selling pressure, suggesting that further declines could be forthcoming. With SUI navigating this bearish shift, market participants are vigilantly observing potential support levels, contemplating whether the asset can find stability or if sellers will persist in pushing prices lower.

Contents
Market Overview: SUI’s Transition to Bearish TerritoryPotential Price Targets: How Low Could SUI Go? 

This analysis delves into SUI’s recent plunge into bearish territory, investigating the consequences of the RSI’s decline and the likelihood of further price drops. It aims to shed light on the downside risks facing SUI by evaluating critical technical indicators and support levels throughout this piece.

Market Overview: SUI’s Transition to Bearish Territory

On the 4-hour chart, SUI has displayed significant bearish momentum, trading beneath the 100-day Simple Moving Average (SMA) as it nears the $1.4 mark, and forming multiple bearish candlesticks. The 100-day SMA, usually a vital support level, now serves as resistance, indicating a shift in sentiment where sellers dominate.

SUI

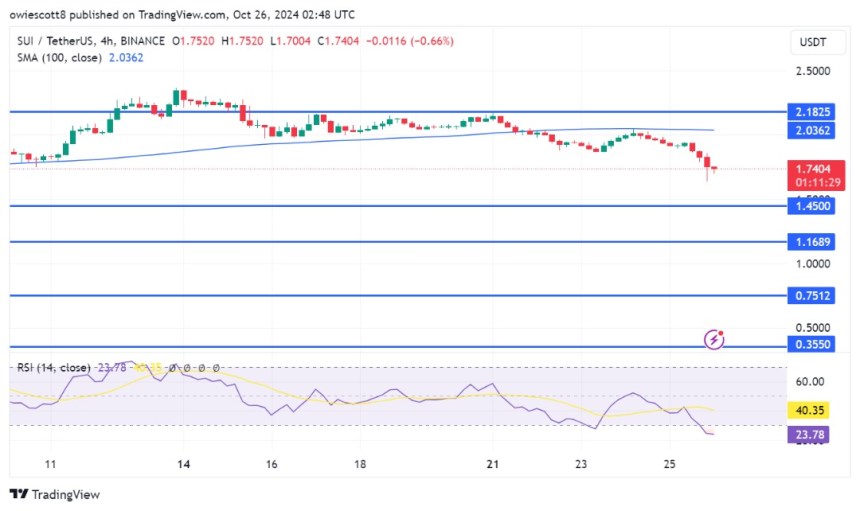
An examination of the 4-hour Relative Strength Index (RSI) shows that the indicator has declined to a low of 23%, following a prior recovery attempt that failed to maintain at 52%. With the RSI now in the oversold territory, selling pressure might be excessive; unless a significant uptick in buying interest occurs, SUI could remain under pressure, potentially leading to further declines.

Moreover, on the daily chart, SUI is displaying a distinct negative trajectory as it trends downward toward the $1.4 level, approaching the 100-day SMA. The $1.4 level, in conjunction with the 100-day SMA, forms a crucial support zone, and a breach below these levels could further reinforce the existing downtrend, possibly paving the way for additional decreases.

SUI

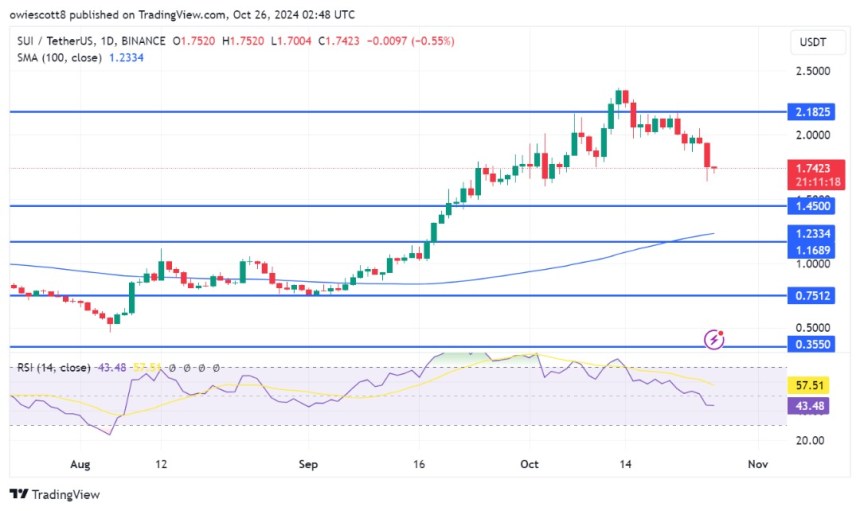
Lastly, the daily RSI for SUI has fallen to 42%, significantly dipping below the pivotal 50% level, which typically distinguishes bullish from bearish territory. This decline normally underscores the strong bearish momentum, suggesting that sellers are firmly in control, and reflecting growing pessimism regarding SUI’s price.

Potential Price Targets: How Low Could SUI Go? 

As SUI persists in its downward trajectory, traders must identify potential price targets. If the $1.4 support level is broken, SUI could decline to $1.23, where buying interest might emerge. A further drop past this threshold could initiate a deeper correction toward other support levels.

Conversely, if the cryptocurrency manages to maintain its position above $1.4, it could signal a potential reversal, allowing bulls to regain some control in the market and drive the price upwards toward the $2.1 resistance level and beyond.

SUI

You Might Also Like

Netherlands Introduces Crypto Tax Compliance Aligned with EU

$22M Crypto Scam Takes $21.6M from 40,000 Investors

XRP Active Addresses Soar—Is a Market Shift on the Horizon?

Bitcoin’s Capital Inflows Surge: Investors’ Demand Grows Strong

Ethereum Netflow Jumps to Derivatives – Will Prices Move Soon?

Share This Article
Facebook Twitter Email Print
Previous Article Claude.ai Launches Advanced Tool for Enhanced Data Analysis
Next Article US Government Loses $20M in Seized Assets After Suspected Hack
Leave a comment

Leave a Reply Cancel reply

Your email address will not be published. Required fields are marked *

Stay Connected

FacebookLike
TwitterFollow
YoutubeSubscribe
TelegramFollow
- Advertisement -
Ad image

Latest News

4 Cryptos to Challenge Solana: Potential Growth for Investors
Defi
Bitcoin ETF Inflows Exceed $3B, Demand Reaches 6-Month Peak
ETFs
Japan’s Push for Bitcoin and Ethereum ETFs Gains Momentum
Institutions
Ripple Appeals Court Ruling on XRP’s Institutional Sales
Meme
//

We influence millions of users and is the number one Crypto and Web3 news network on the planet

Sign Up for Our Newsletter

Subscribe to our newsletter to get our newest articles instantly!

© 2022 Foxiz News Network. Ruby Design Company. All Rights Reserved.
nl Dutchen Englishfr Frenchde Germanel Greekit Italianpt Portugueseru Russianes Spanish
en en
Join Us!

Subscribe to our newsletter and never miss our latest news, podcasts etc..

Zero spam, Unsubscribe at any time.
Welcome Back!

Sign in to your account

Lost your password?