


Solana has reached the vital $137 support level, and the bulls are under significant pressure to avert a downward breakout. With market momentum teetering, all attention is on whether the bulls can maintain this critical area and trigger a potential rebound. A robust defense at this level could indicate a resurgence of bullish strength, while a breakdown could open the door to further declines.
As traders speculate on Solana’s upcoming movements, this article will delve into its critical test at the $137 support level, emphasizing whether the bulls can withstand the mounting pressure. It will assess the likelihood of a breakout versus a rebound, providing insights into SOL’s short-term price direction by examining essential technical indicators and market sentiment.
Assessing the RSI and Moving Averages: Bullish or Bearish Perspective?
Recently, after struggling to surpass the $164 resistance level, Solana has taken a downward trajectory on the 4-hour chart. The price is currently trading below the 100-day Simple Moving Average (SMA), indicating a shift in market sentiment, as SOL now aims for a potential bearish breakout at the $137 level. If the price continues to fall and breaches this support, it could incite prolonged selling pressure and lead to additional losses.

An examination of the 4-hour Relative Strength Index (RSI) shows that the RSI has dipped to around 33%, indicating a decrease in buying pressure that reflects a shift in market dynamics. An RSI reading below 40% is often a sign that an asset may be entering oversold territory, potentially leading to further declines.
On the daily chart, SOL is exhibiting clear negative movement, as demonstrated by a series of bearish candlesticks. This ongoing downward trend highlights the prevailing selling pressure in the market, suggesting that bears are firmly in control. Furthermore, Solana is trading below the 100-day SMA, indicating a lack of bullish momentum and reinforcing the likelihood of continued declines.
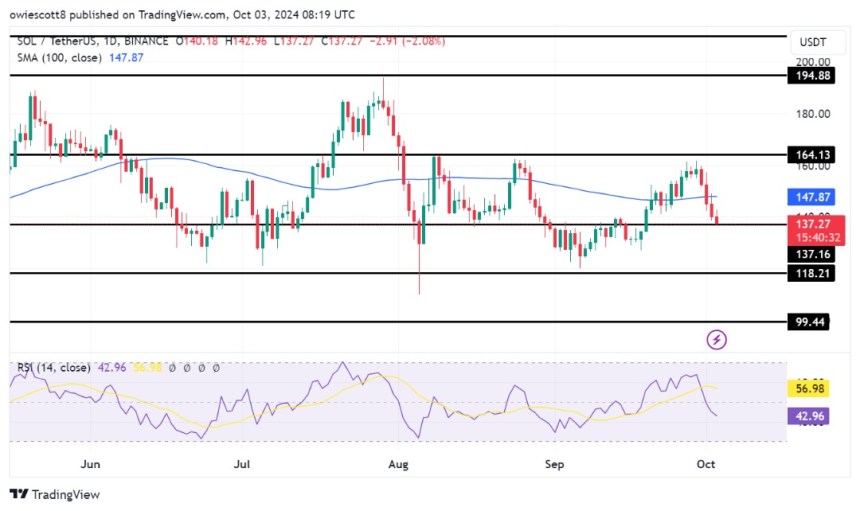
Finally, on the 1-day chart, a detailed examination of the RSI formation reveals that the RSI signal line has fallen to 43%, having recently broken below the crucial 50% mark. An RSI value below 50 typically indicates bearish sentiment, suggesting that the asset is losing strength. This decline could indicate further downside potential for SOL unless a reversal takes place.
Critical Support Level at $137: Can Solana Bulls Maintain Their Ground?
The $137 support level is pivotal for Solana, serving as a crucial battleground between bulls and bears. If the bulls manage to defend this support, it could boost market confidence and set the stage for a potential recovery toward the $164 resistance level.
However, a fall below the $137 support level could trigger substantial selling pressure, leading to further declines toward the $118 support level. Should this level be breached, it might result in heightened losses, with potential targets around the lower support areas near the $99 mark. Such a situation would escalate bearish sentiment and could contribute to a more pronounced downtrend in Solana’s price.


 Dutch
Dutch English
 French
 German
 Greek
Greek Italian
 Portuguese
 Russian
 Spanish