


Solana continues to maintain gains above the $150 resistance level. The SOL price is in a consolidation phase and may look to initiate a new upward trend above the $162 resistance mark.
- SOL price has kicked off a new upward movement above the $155 territory against the US Dollar.
- The price is currently hovering around $155 and remains above the 100-hourly simple moving average.
- A significant rising channel is forming, with support situated at $155 on the hourly chart of the SOL/USD pair (data obtained from Kraken).
- If the pair remains above the $155 support area, it could begin another rally.
Solana Price Gathers Momentum
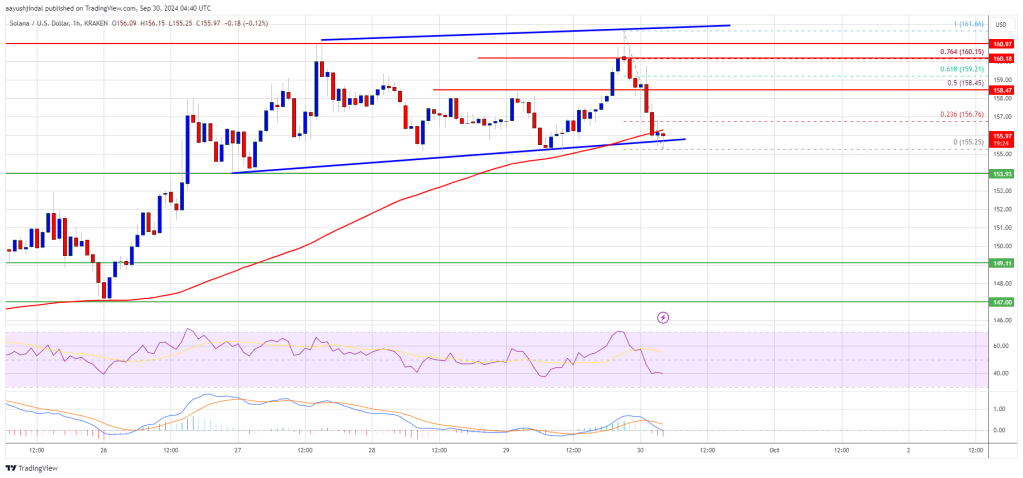
The price of Solana increased beyond the $155 resistance level, following similar trends seen in Bitcoin and Ethereum. SOL even surpassed $160 before facing selling pressure. A peak was reached at $162, leading to a correction in price.
After a retreat below the $160 and $158 thresholds, bullish activity was observed around the $155 support region. A low was established at $155, and the price is now stabilizing below the 23.6% Fibonacci retracement level of the recent decline from the $162 swing high to the $155 low.
Currently, Solana is trading close to $155 and above the 100-hourly simple moving average. Additionally, a significant rising channel is forming with support at $155 visible on the hourly chart of the SOL/USD pair.
On the upside, the price is encountering resistance around the $158 mark. The following key resistance is located near the $160 level, coinciding with the 76.4% Fibonacci retracement level from the recent drop between the $162 peak and the $155 low. The main resistance could be around $162.
A successful closure above the $160 and $162 resistance levels could pave the way for a steady increase thereafter. The next significant resistance is located near $175. Should gains continue, the price could approach the $180 level.
Potential Additional Declines for SOL?
If SOL fails to surpass the $158 resistance, it might enter another downward trend. Initial downside support lies around the $155 level, with the first major support at approximately $154.
A decline below the $154 threshold may lead the price toward the $149 zone. Should there be a closure beneath the $149 support, the price could further decline towards the $142 support level in the near future.
Technical Indicators
Hourly MACD – The MACD for SOL/USD is losing momentum within the bullish area.
Hourly RSI (Relative Strength Index) – The RSI for SOL/USD is positioned below the 50 level.
Key Support Levels – $155 and $149.
Key Resistance Levels – $158 and $162.


 Dutch
Dutch English
 French
 German
 Greek
Greek Italian
 Portuguese
 Russian
 Spanish