


- Simon’s Cat (CAT) has entered into the price discovery stage and reached its ATH on September 21st.
- Major technical indicators suggest a possibility of a short-term slowdown.
Recently, Simon’s Cat [CAT] moved into price discovery mode, achieving a new ATH of $0.0000464 on September 21. The meme token experienced an explosive surge but has since lost momentum after breaking out of its short-term rising wedge pattern.
As of this writing, CAT is priced at $0.0000391, reflecting a decline of approximately 6.5% over the past 24 hours following a bearish breakout.
Simon’s Cat price forecast: Will RSI spark a short-term rally?
Like many meme tokens, CAT experienced a surge shortly after its launch, fueled by significant investor enthusiasm. This excitement enabled the meme token to double its value in just over two weeks.
Despite the recent deceleration, CAT’s RSI (Relative Strength Index) is showing early signs of a bullish divergence. The price achieved higher highs, whereas the RSI recorded lower lows.
Such a divergence frequently indicates a potential momentum reversal, which could provide buyers with an opportunity for a short-term rally before another pullback.
If the bullish divergence is confirmed, CAT might rebound toward the $0.000041 resistance level and potentially revisit its ATH in the upcoming sessions.
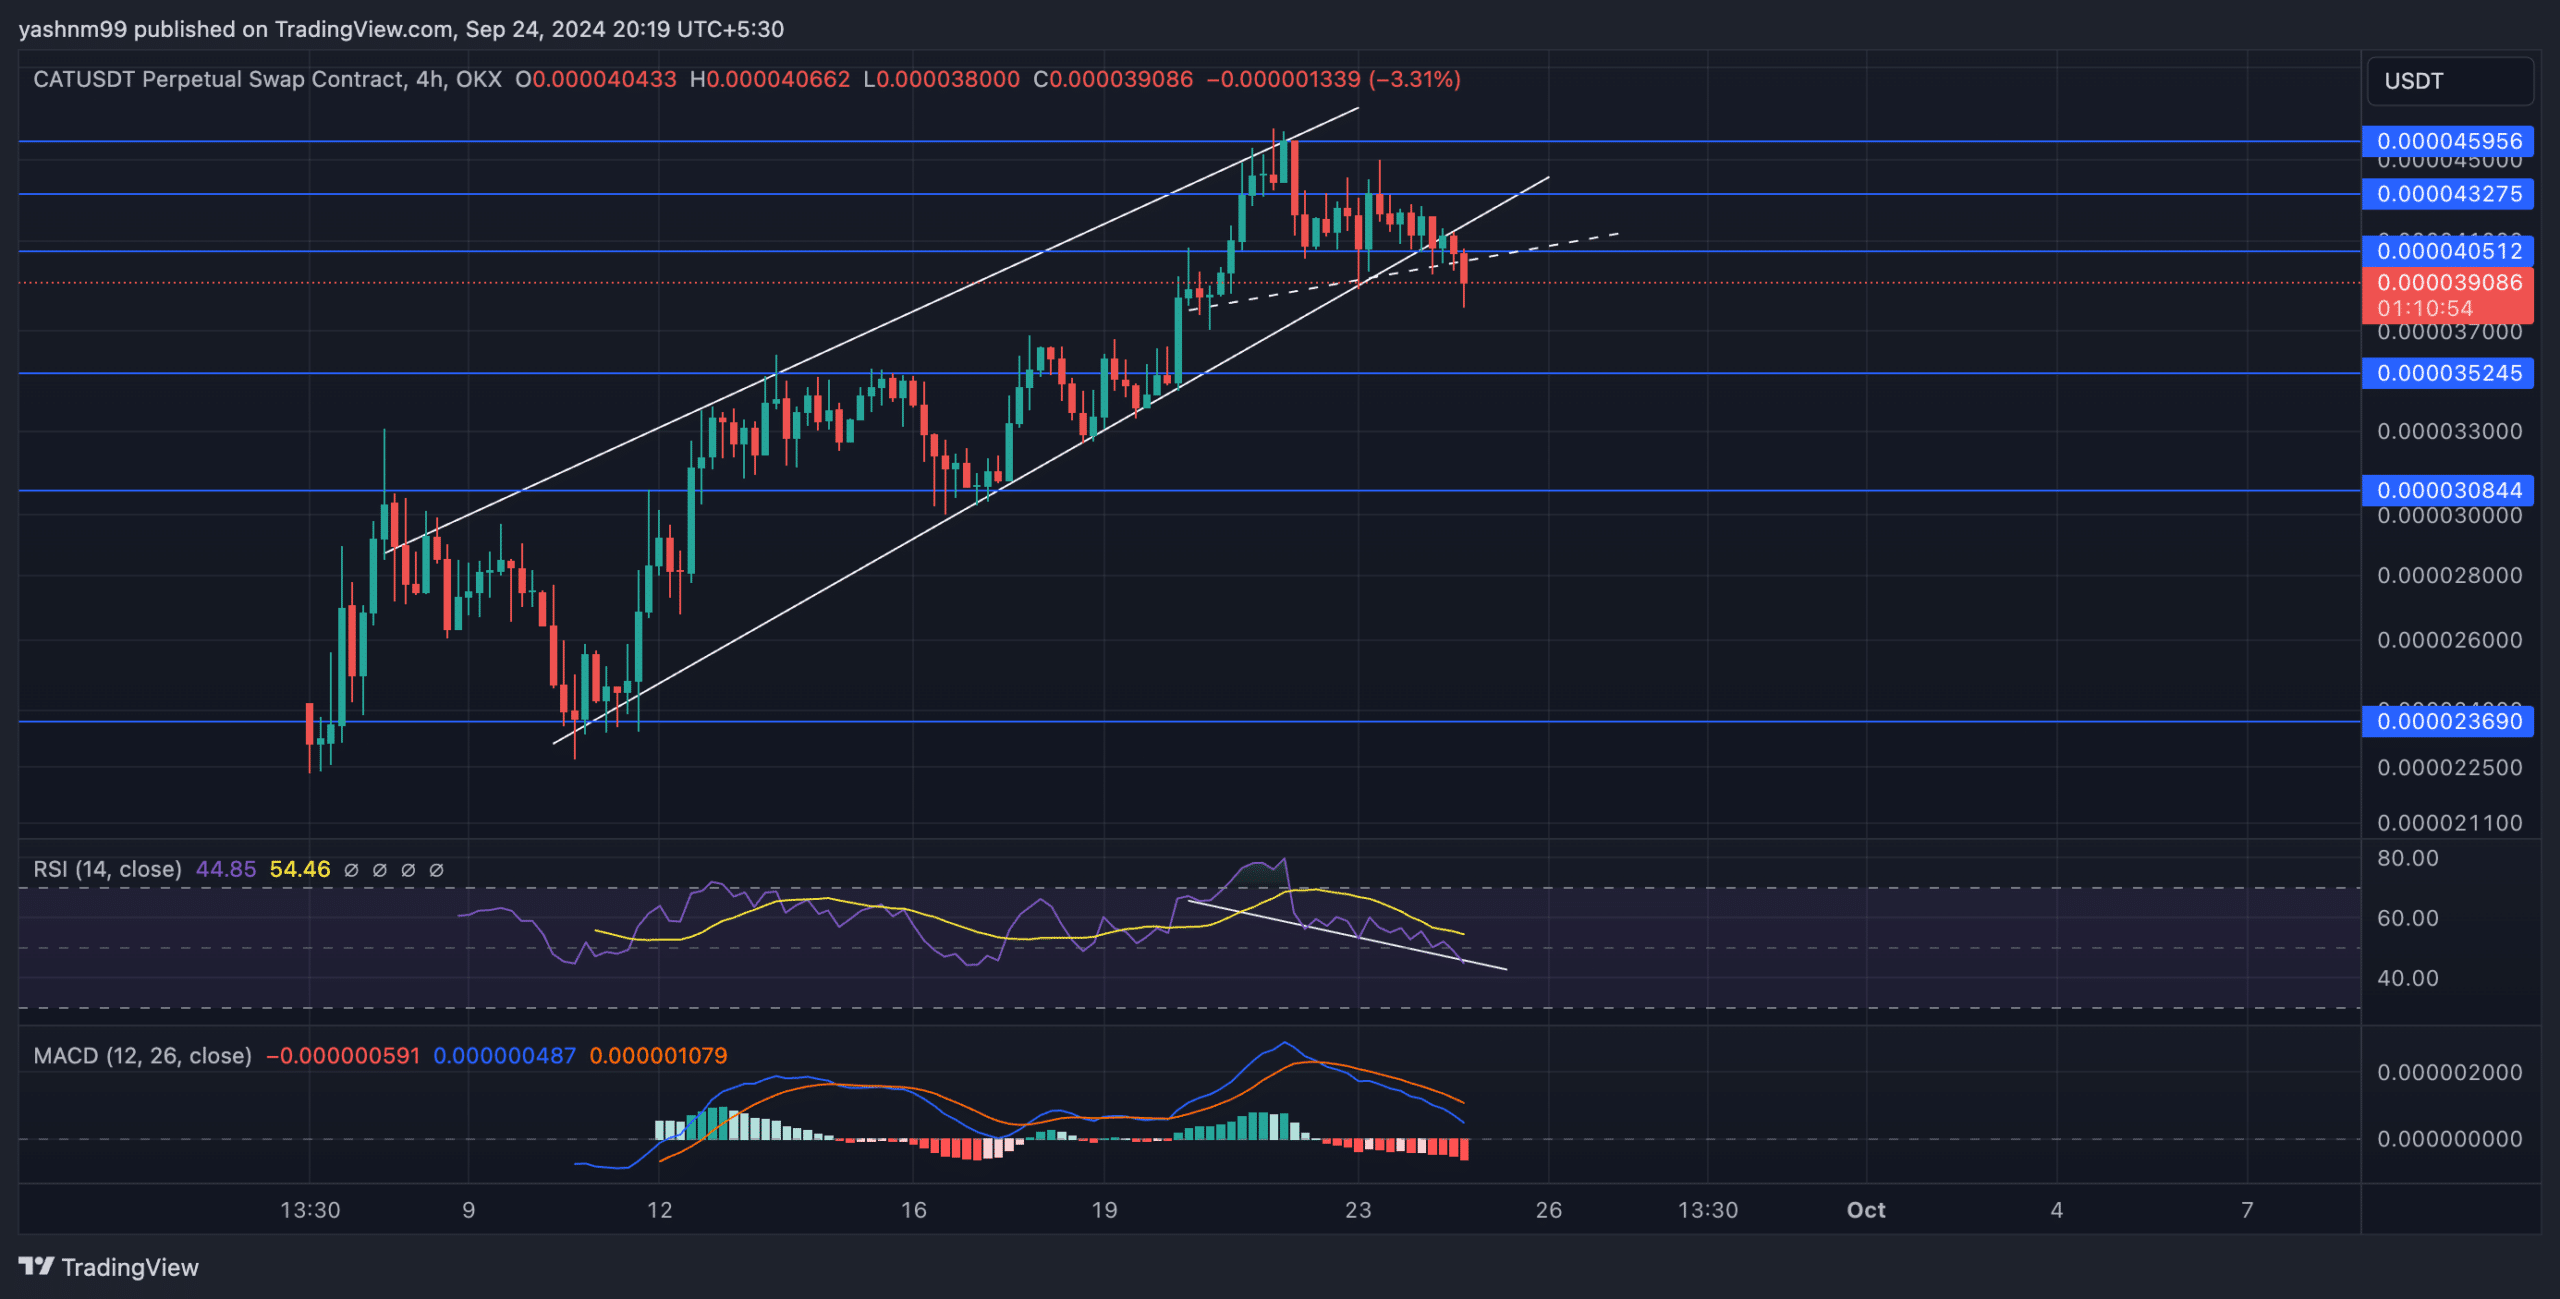
Source: TradingView, CAT/USDT
Conversely, the recent breakout from the rising wedge pattern heightens the chance of a further pullback. Should selling pressure persist, CAT might find support levels at $0.0000352 and $0.0000308 before attempting a rebound.
The RSI is currently around 45, significantly below its moving average line, indicating a shift in momentum toward sellers.
Additionally, the MACD indicator (moving average convergence divergence) has shown a bearish crossover, with the MACD line falling beneath the signal line, a pattern typically signaling the onset of a short-term bearish trend. If these lines drop below zero, it would reinforce a stronger downtrend.
The path forward
Simon’s Cat (CAT) is at a crucial junction after hitting a new ATH and subsequently retreating from a rising wedge breakout. The bullish divergence indicated by the RSI implies a possibility of a short-term rally, though traders should exercise caution as other technical indicators like the MACD suggest waning momentum.
A breakout above $0.0000405 could reignite bullish sentiment, pushing prices toward $0.0000464, whereas a continued downward trend might test support at $0.0000352 and $0.0000308.
Traders should carefully observe these critical levels and the general market sentiment to seize the opportunity in CAT’s upcoming moves.


 Dutch
Dutch English
 French
 German
 Greek
Greek Italian
 Portuguese
 Russian
 Spanish