Market Overview #262 (3rd April 2024)
Welcome to the 262nd edition of my Market Overview.
This week, I will discuss Bitcoin, Ethereum, Cardano, Polygon, Optimism, Casper, and Realio.
If you have any suggestions for next week, please don’t hesitate to reach out via email or in the comments section.
Bitcoin:
Monthly:
Weekly:
Daily:
Price:
Market Cap:
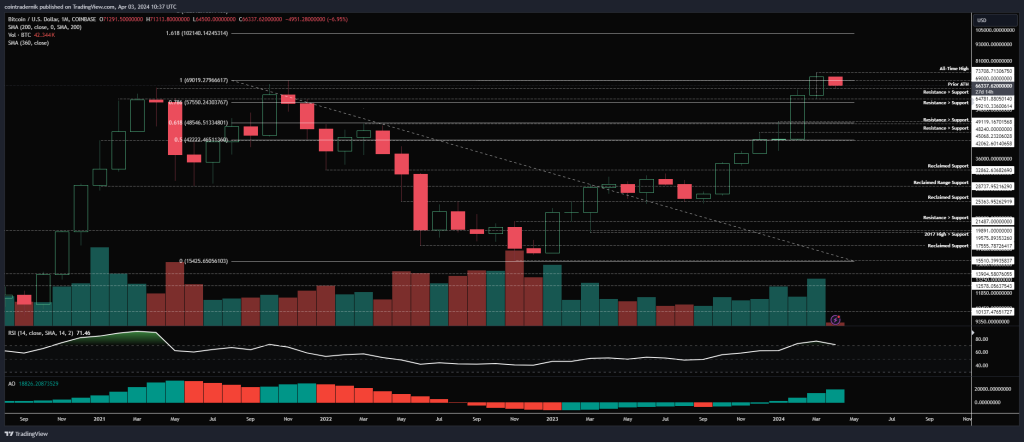
Analysis: Reviewing the monthly chart for BTC/USD, we observed that last month marked the highest close for Bitcoin on its largest volume in over a year, closing solidly through $69k and reaching $71.3k. As you might guess, this is not a bearish sign. From this viewpoint, as long as we remain above $58k in April, the outlook appears bullish for the upcoming quarter. If April ends below $58k, we might face some challenges, as it would suggest a possible false breakout instead of a genuine one. However, given the current volume profile and structure, I’m inclined to believe that any dips in April should be viewed as buying opportunities. Moving forward, if we stay above $58k, I anticipate seeing $100k traded by Q3, and we can further analyze this in the weekly chart…
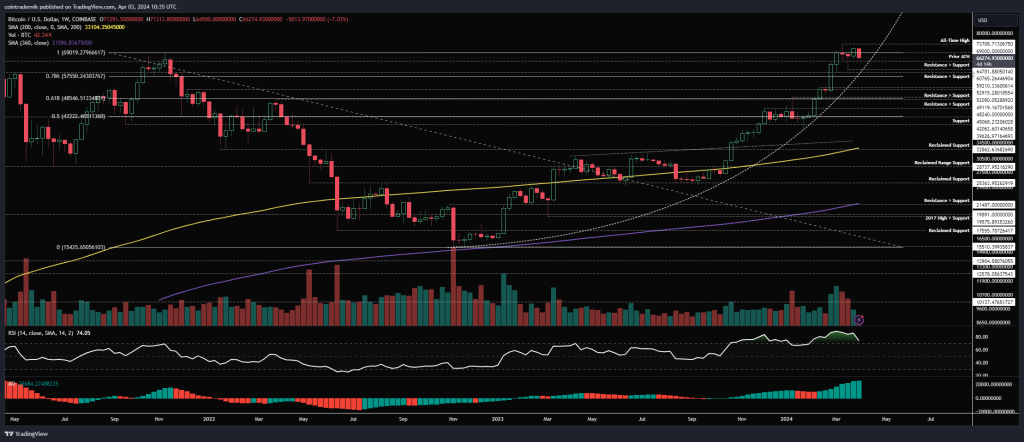
In the weekly overview, the primary takeaway is that despite four weeks of consolidation close to these all-time highs, the parabolic advance remains intact, and we can still consolidate for a few more weeks without breaking this trend. Weekly momentum indicators continue to indicate upward movement without showing signs of exhaustion thus far. At worst, assuming the parabola holds, I expect to see a quick wick below $61k into $59k, followed by a rapid bounce from that point. A more optimistic scenario might involve forming a higher low this week above $61k, allowing for another attempt at all-time highs next week, leading to an eventual breakout before May and further price discovery, with gains accelerating towards $100k by July.
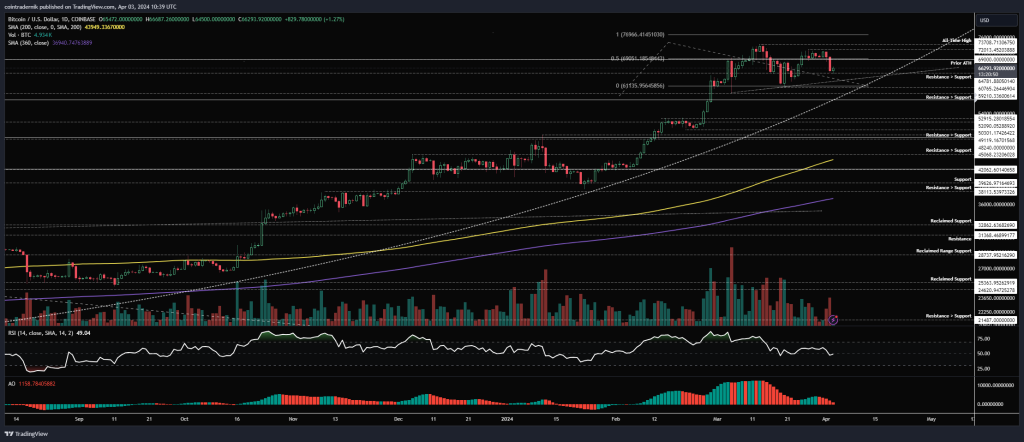
Eventually, the parabola will break: it may happen soon, leading to an extended period of consolidation through summer before a reversal likely late in Q3 as we approach the election cycle; or perhaps in several months, after which the cycle following a parabolic break at around $140k becomes unclear. Examining the daily chart reveals the formation of what appears to be an ascending triangle moving toward those all-time highs and beyond the parabola’s curve. A daily close below this would signal a potential loss of momentum, possibly heralding a larger downward move toward the $49-53k range in the weeks ahead. Conversely, should we continue forming higher lows into mid-April, the likelihood of pushing through $74k and starting the next leg seems high. The liquidation cascade scenario may involve a sharp wick through $61k leading to a dip into $59k—likely within the coming week—before a strong recovery ensues that leaves late shorts trapped and liquidated longs chasing the price upwards. Let’s monitor how the week concludes…
Ethereum:
ETH/USD
Weekly:
Daily:
ETH/BTC
Weekly:
Daily:
Price:
Market Cap:
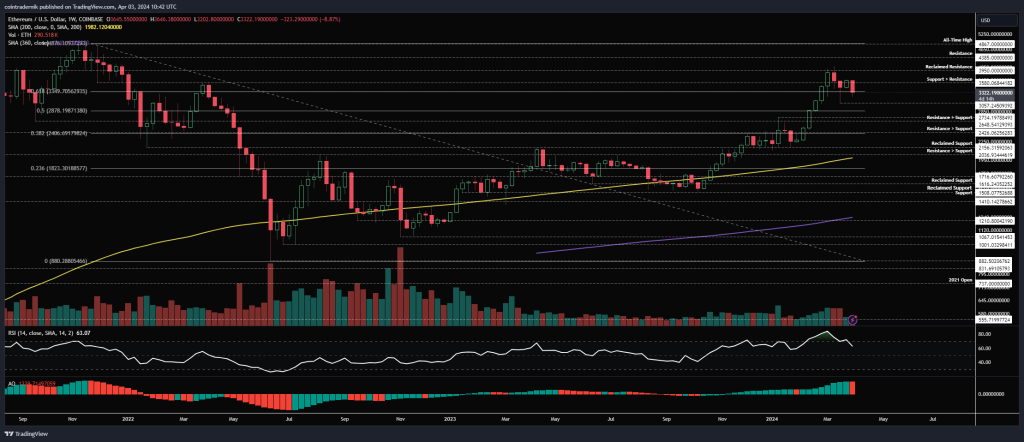
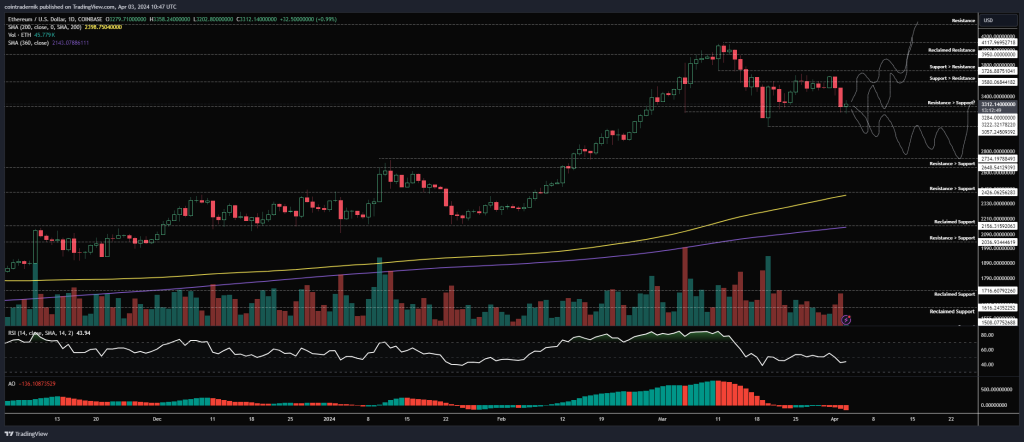
Analysis: Let’s start with ETH/USD on the weekly chart, where the pair has been consolidating just below the $3580 resistance, having closed slightly above it last week but with low volume in a constrained range. Early this week, we saw a decline from that open back towards the prior low at $3057. Currently, the pair sustains above that low; however, its direction seems dependent on BTC/USD over the next week or so. Shifting to the daily for clarity, we observe a lower high forming below $3726, while the price currently finds support at $3222—the early March low. If this support holds through the week, I expect a continuation upwards through $3726, negating the lower high next week. Conversely, if we close below $3222, the expectation would be for $3057 to be breached. The following price action will be reactionary: if we sweep below $3057 but close back above, followed quickly by reclaiming $3222, it could signify a bottom and a continued upward trend; however, a close beneath $3057 with that level acting as resistance likely pushes us back to $2735 before a subsequent bottom forms. My inclination currently leans toward one of the first two scenarios since unless BTC/USD falls below $59k, I don’t foresee ETH approaching $2735.
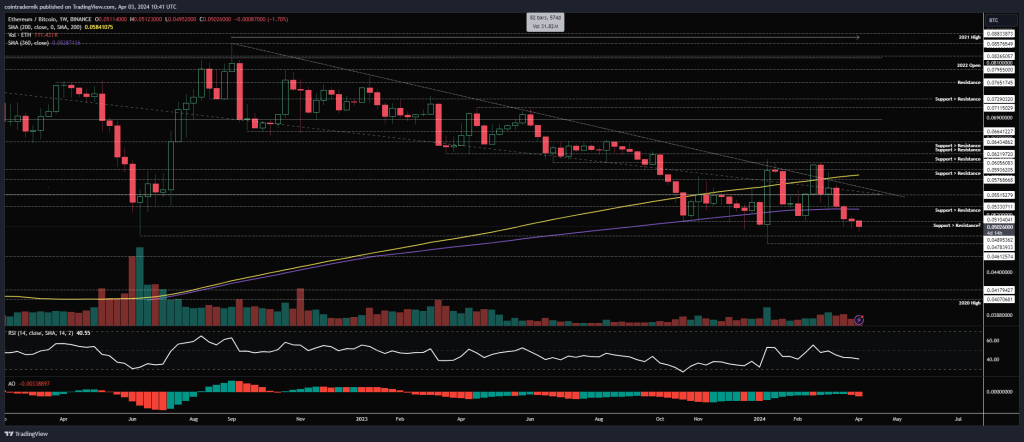
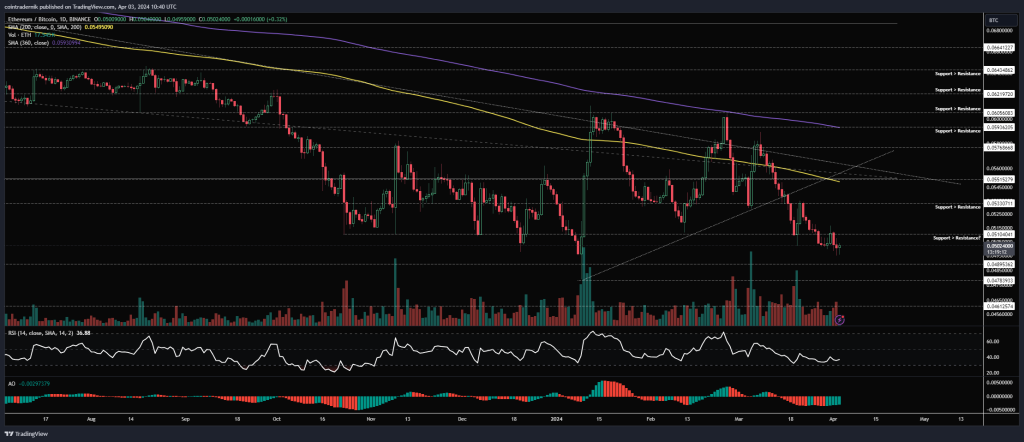
As for ETH/BTC, the pair is looking particularly weak after the past couple of weeks of gradual declines, currently dipping below the significant support at 0.051. A close below this level could lead to taking out the yearly low at 0.0478, heading toward 0.0461. Alternatively, if we close the week above 0.051, similar to the last couple of weeks, it would indicate some bullish strength; we might just be establishing a choppy local bottom. It’s tough to find excitement for ETH given the current state of the BTC pair, but a clearer direction should be expected in the coming weeks…
Cardano:
ADA/USD
Weekly:
Daily:
ADA/BTC
Weekly:
Daily:
Price:
Market Cap:
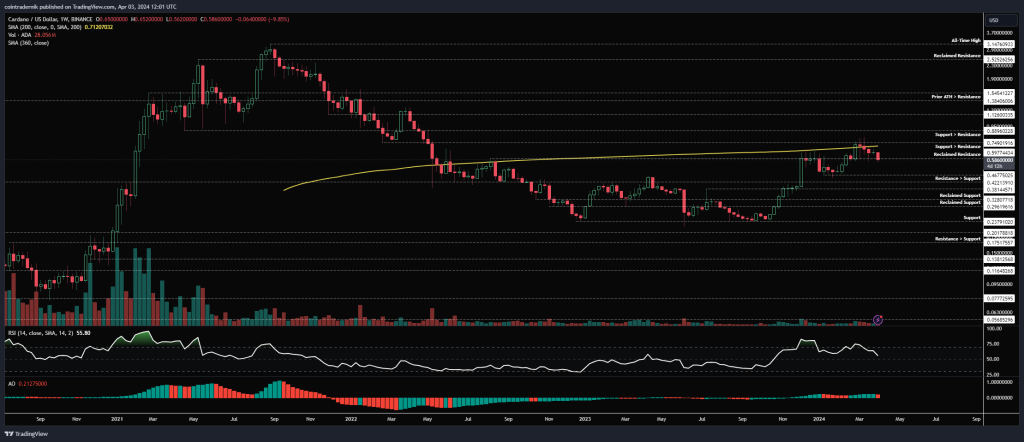
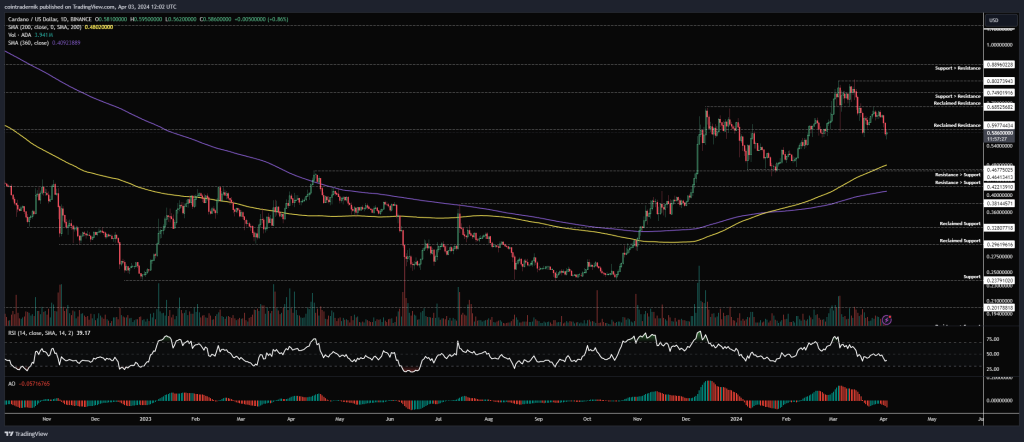
Analysis: Starting with ADA/USD, the weekly chart indicates that price has rebounded to the 200wMA, encountering resistance at $0.75 for a continuous three weeks before declining and now resting just below the resistance of $0.60, which used to act as support. We are witnessing momentum exhaustion in this scenario, reinforcing the notion that Cardano is a laggard, and I foresee a drift towards $0.47 if we close under $0.60 this week. Examining the daily structure reveals that $0.68 once again served as resistance after the price fell back below it, establishing a distinctly bearish structure, with no signs of exhaustion yet. Should we see a rejection off $0.60 as resistance this week, I would anticipate a drop back to the 200dMA and the prior resistance turned support in the $0.47-0.49 range. If bulls manage a turn here, the opportunities appear contingent upon reclaiming $0.68, aiming to buy it as support and subsequently pushing higher into the $0.90 zone.
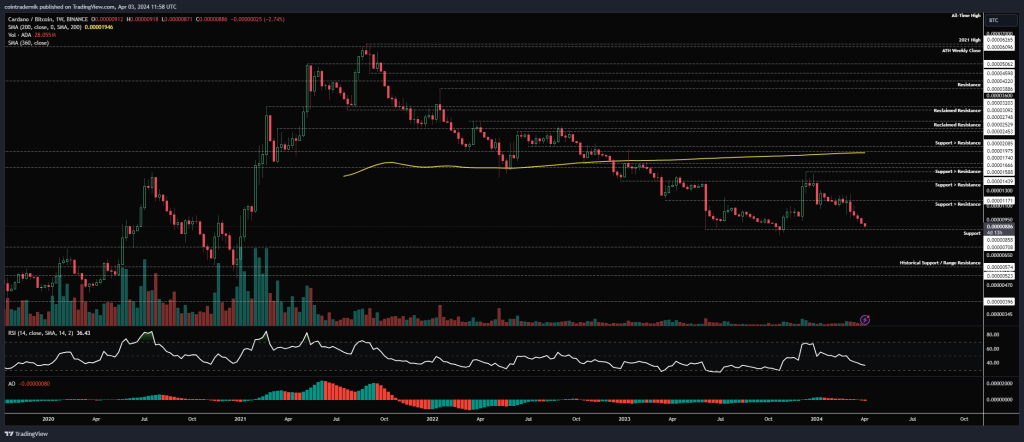
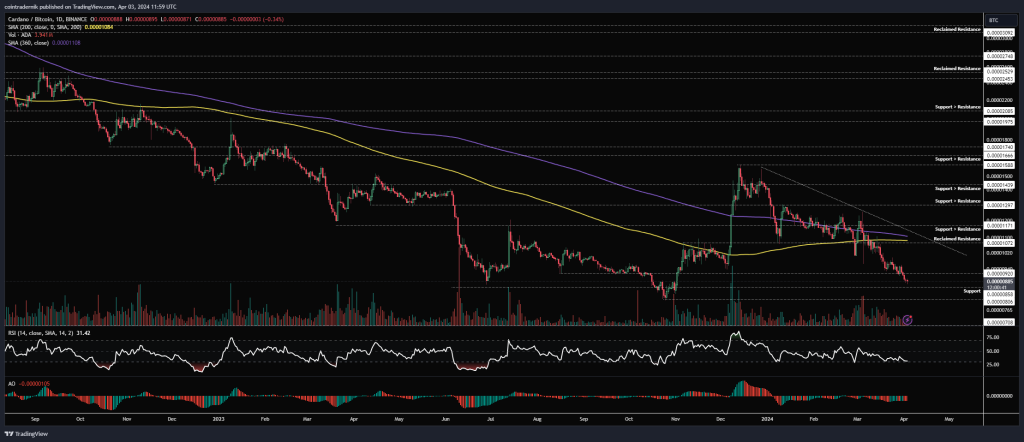
Turning our attention to ADA/BTC, we can see that price was rejected at 1588 satoshis, continuing its downward trend all year, reverting back to support at 858. This revelation is much more encouraging for Cardano’s potential rebound, given the previous positive reactions off this level late last year. However, should we close the weekly beneath 858, it could be catastrophic, leading to another 20% decline towards the next support at 700 satoshis. Should we find support here once more, it could provide some confluence if the Dollar pair can reclaim the $0.68 level for continuation upwards.
Polygon:
MATIC/USD
Weekly:
Daily:
MATIC/BTC
Weekly:
Daily:
Price:
Market Cap:
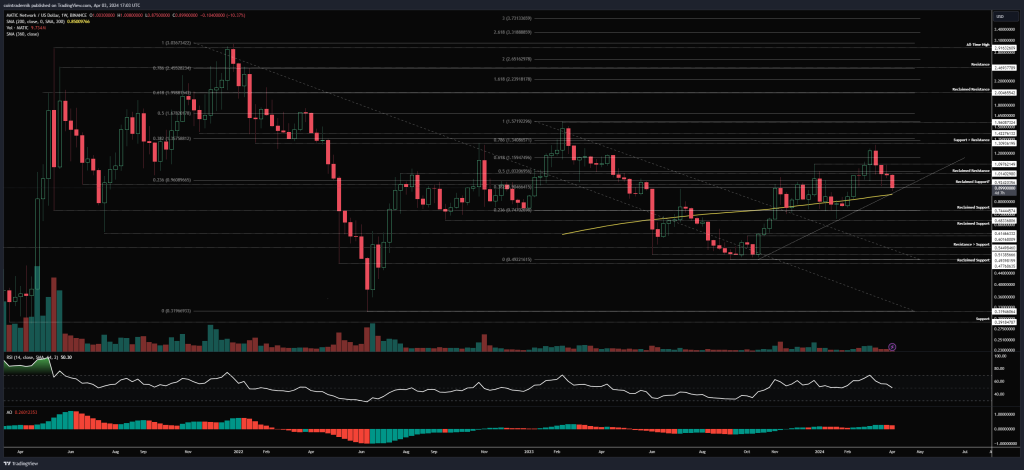
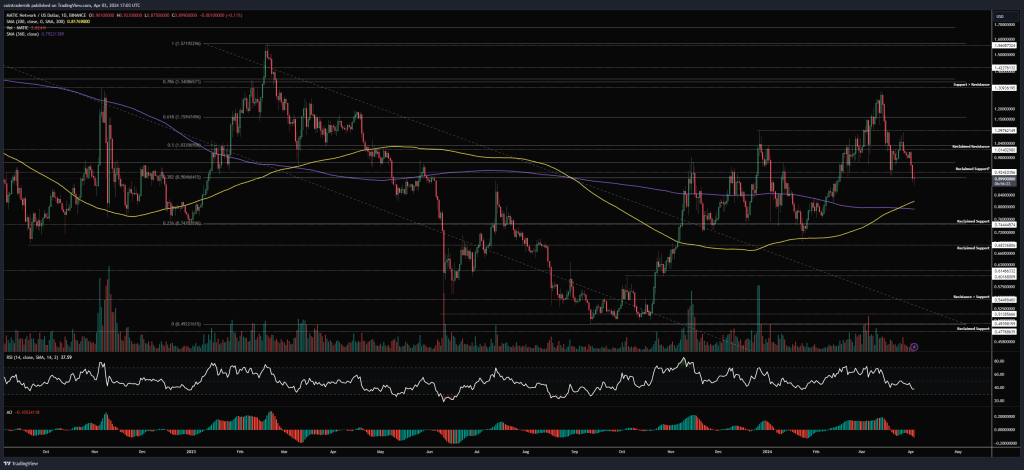
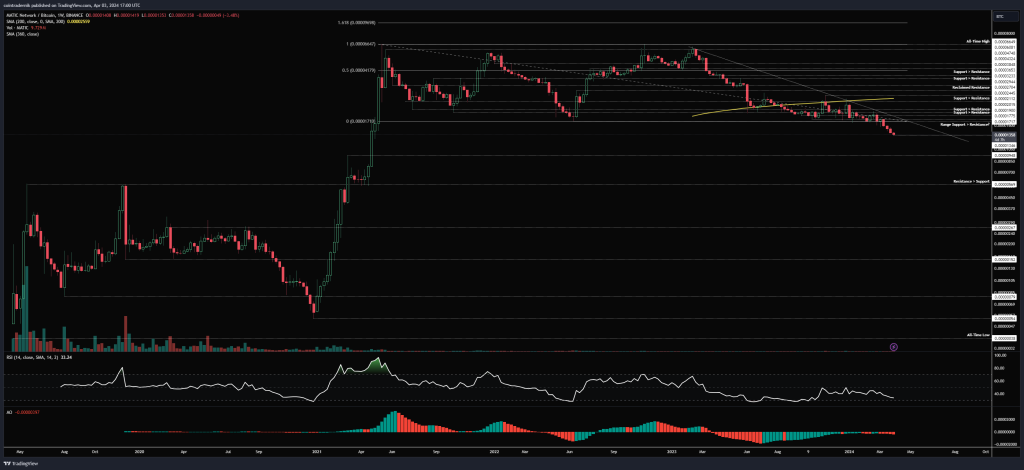
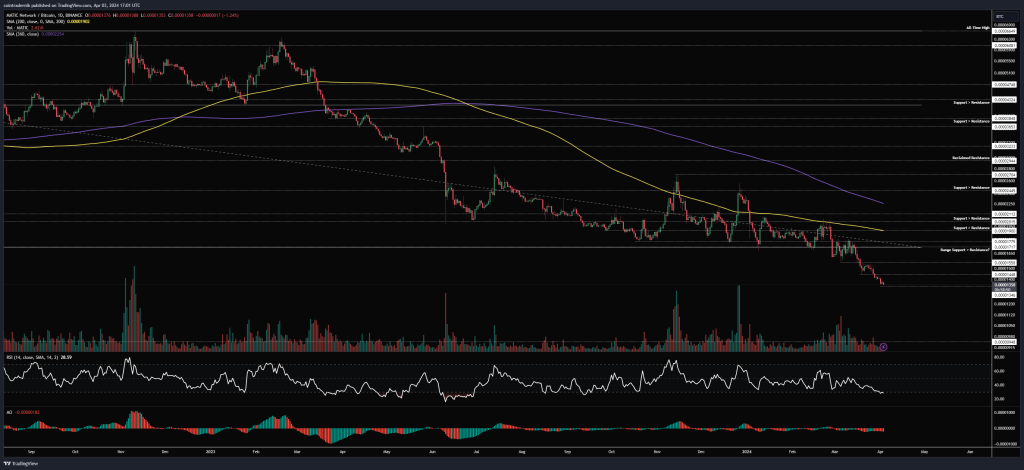
Analysis: When examining MATIC/USD, the weekly chart shows that the price is resting on the trendline support established from the October 2023 low while hovering above the 200wMA, having dipped below the reclaimed support at $0.92 this week. MATIC bulls need to see this area hold and for the price to push back above $0.92 by the week’s end. Doing so would suggest a sweep of local lows into significant support, likely leading to a higher low forming and continuation toward $1.31 and beyond. Conversely, if $0.92 becomes resistance next week and we break below that trendline, I anticipate a further reduction of approximately 20% towards the next key support at $0.74. Analyzing the daily chart, we can see a structure similar to ADA/USD, showing no signs of exhaustion thus far, opening up the potential for a larger decline toward $0.74, with both the 200dMA and the 360dMA positioned slightly above that. If we can capture a bid here and push past $1, this could present an excellent long opportunity targeting the $1.31 retest while hedging there and reopening under acceptance of that level.
Optimism:
OP/USD
Daily:
OP/BTC
Daily:
Price:
Market Cap:
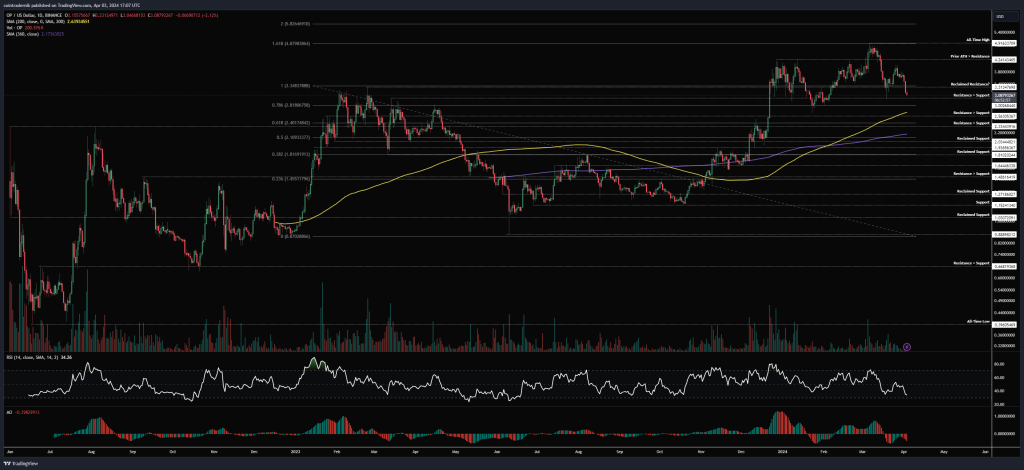
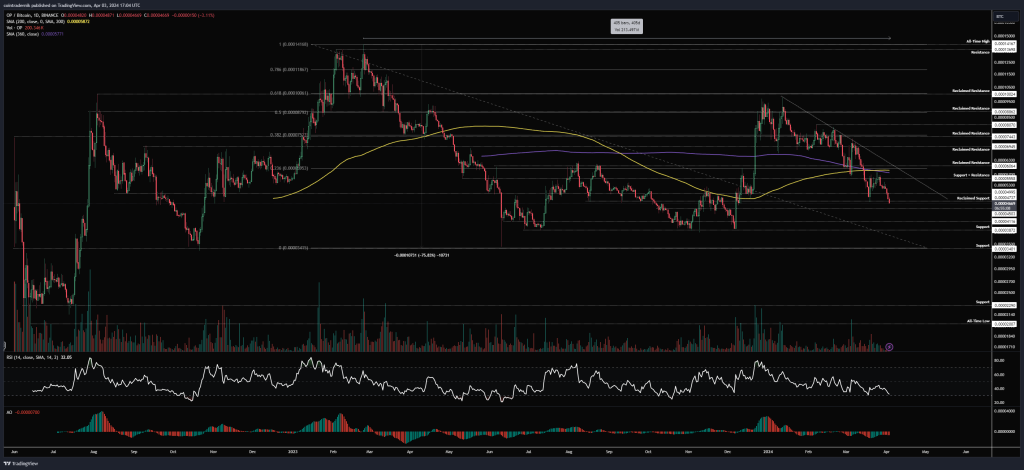
Analysis: In regard to OP/USD, considering Optimism’s relatively brief price history, we can note that it achieved an all-time high around $4.92 in March, from which it has retracted, breaking back below prior highs turned resistance at $4.24, and is now testing support at $3, which it currently holds. The structure remains bearish alongside momentum; however, the Awesome Oscillator indicates signs of potential exhaustion. Nonetheless, I anticipate continued decline toward the 200dMA, likely sweeping the swing low into $2.56 before establishing a bottom. As long as we do not close below $2.33, this still appears to be a broad range above historical support; falling below that would shift the scenario to a more bearish outlook. Should we effectively define a bottom above $2.56, I am eyeing $5.80 as the next target for my long-term holdings.
Casper:
CSPR/USD
Weekly:
Daily:
CSPR/BTC
Weekly:
Daily:
Price:
Market Cap:
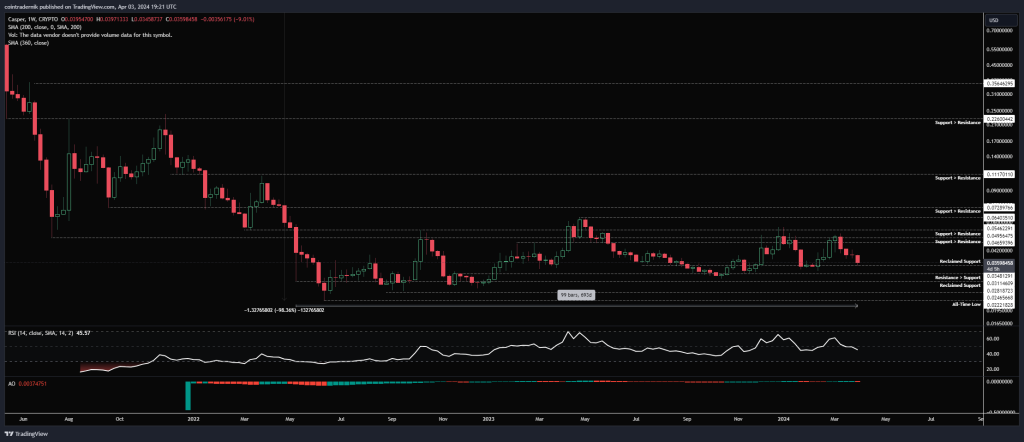
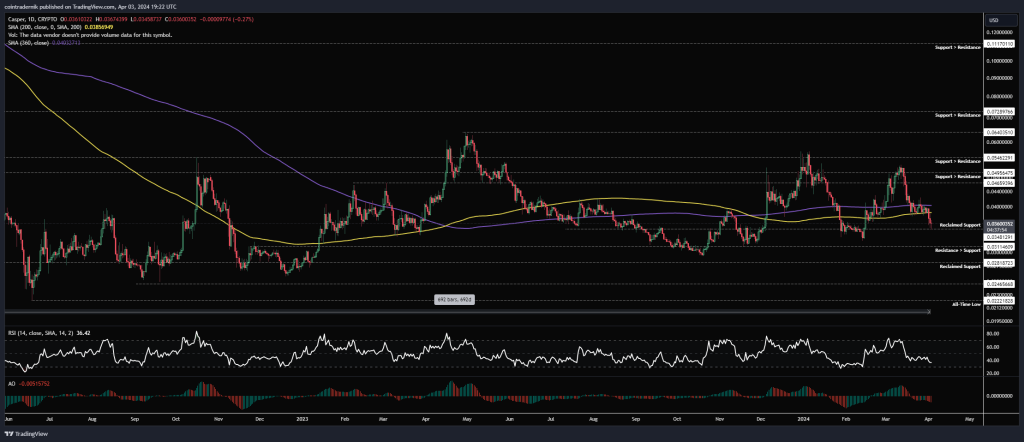
Analysis: Observing CSPR/USD, the weekly chart reveals that the pair has been confined to a broad range for nearly two years, with recent price activity sticking between support at $0.031 and resistance at $0.055. Currently, we are at the bottom of this narrower range while overall experiencing chop. Casper emerged during a bear market, having only known downtrends followed by long periods of flat consolidation. Thus, buying portions close to range support could be worthwhile, alongside increasing your position on a strong weekly close above $0.054, assuming you hold fundamental confidence in the project. Should we break above $0.054, I expect the onset of the first bull cycle, with a minimum target of $0.226 and likely looking beyond $0.36 as it has yet to experience a bull cycle.
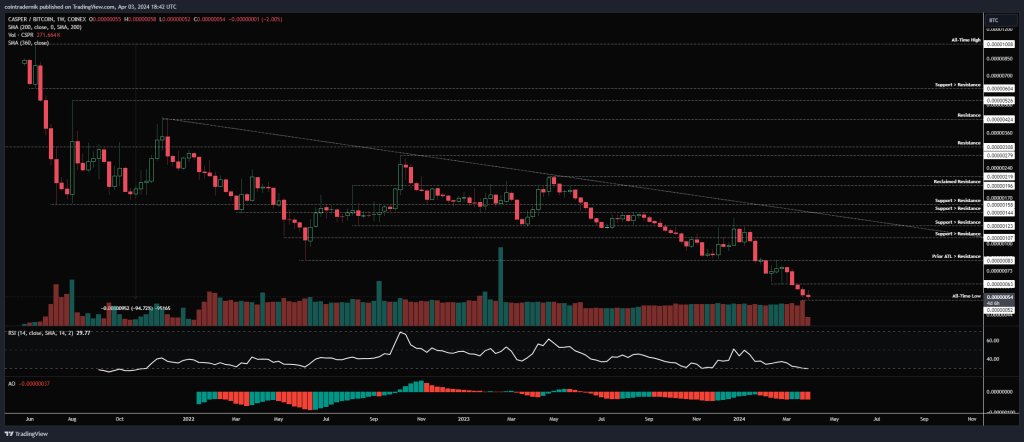
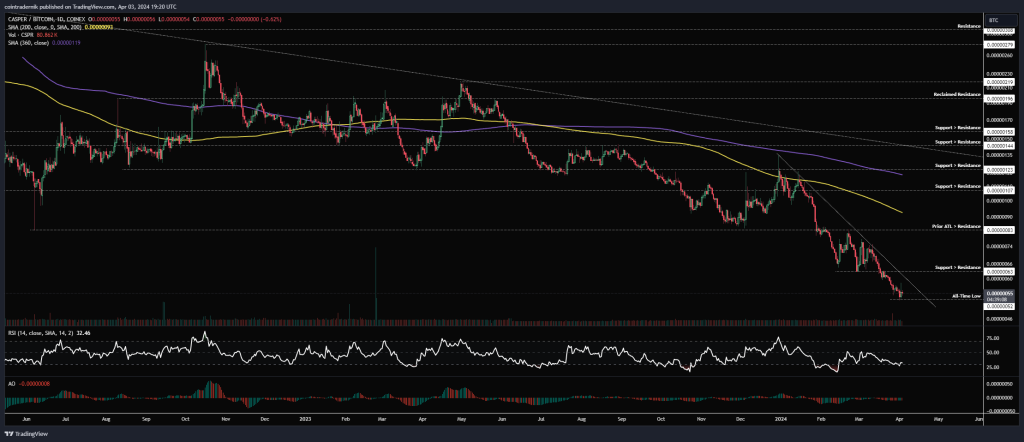
In contrast, CSPR/BTC is still trending downwards since inception, characterized by breaking below previous all-time lows at 83 satoshis, touching down at 63 before turning that into resistance and now resting at 52 satoshis. Signs of a minor trend exhaustion have emerged, but bearish price discovery continues. I would be seeking a clear indication of bullish sentiment via structure and momentum before deciding to enter. If we delve into the daily chart, this may appear as a trendline breakout followed by reclaiming 63 satoshis as support, which could serve as a favorable entry. A drop below 52 could lead to uncertainty about where this might stop.
Realio:
RIO/USD
Weekly:
Daily:
RIO/BTC
Weekly:
Daily:
Price:
Market Cap:
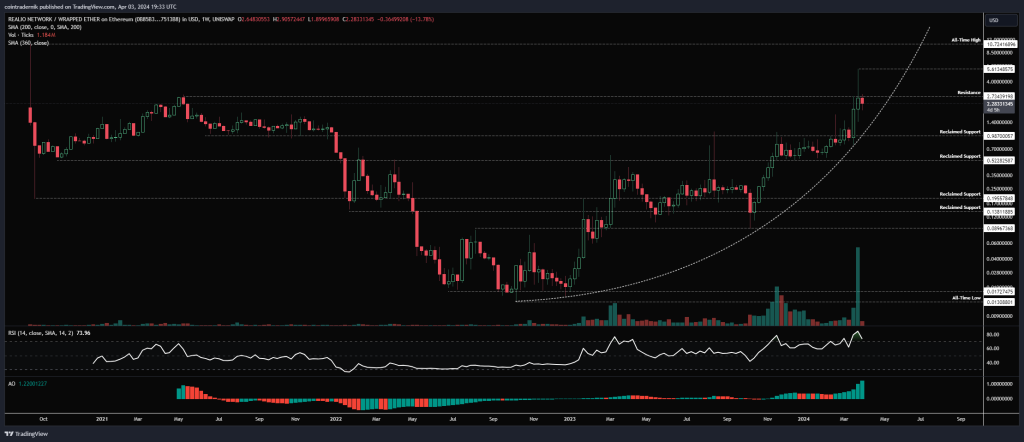
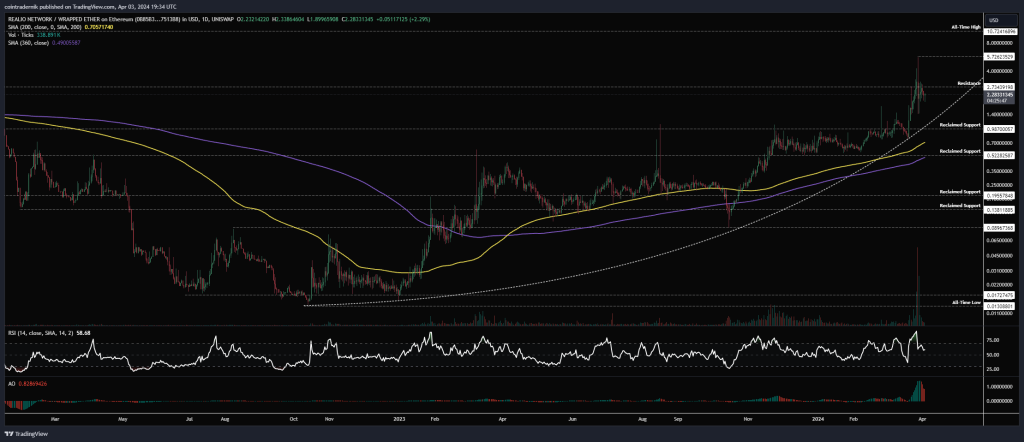
Analysis: For RIO/USD, the weekly chart presents a strong uptrend since November 2022, maintaining a parabolic advance. Last week, the pair surged through the last resistance level at $2.74 with significant volume, reaching $5.61, but ultimately retraced and closed back at $2.73. Momentum indicators show no signs of exhaustion, and I expect a couple of weeks of consolidation here before the breakout is confirmed, allowing the price to trend towards the all-time highs at $10.72 over the next few months. As long as the parabola remains intact, we can anticipate continued progress. A breach of the parabola would likely indicate a deeper correction towards $0.99 before any further upward movement.
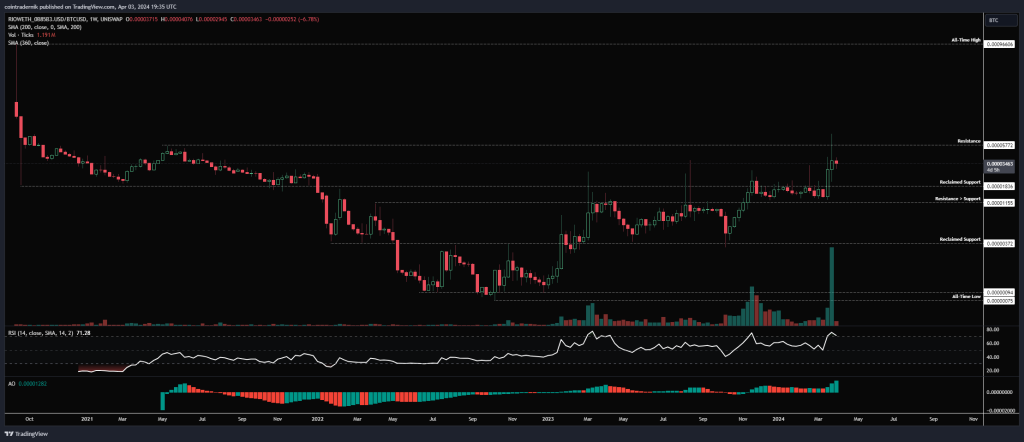
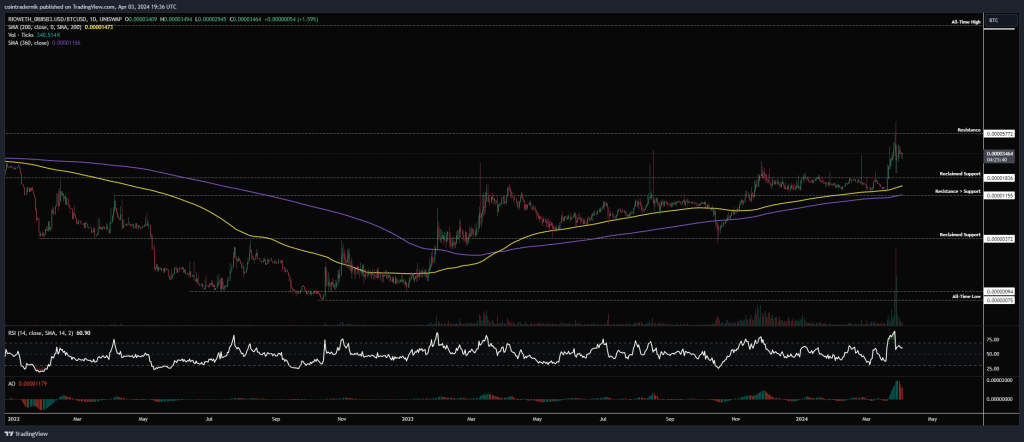
In terms of RIO/BTC, the weekly structure appears predominantly bullish. Last week, the price managed to close above a cluster of resistance with significant volume and new highs evident on momentum indicators, settling around 5772 satoshis while now consolidating between there and the reclaimed support at 1836. As mentioned earlier, I would expect continued consolidation here until we achieve a weekly close above 5772, which would trigger the steepest ascent along the parabola, with no resistance encountered until approaching all-time highs. While the testing of 96k satoshis has arisen, this might be a typographical error; regardless, surpassing 6k satoshis enters a territory of price discovery for the BTC pair. Provided this structure holds above 1155, the bullish outlook remains intact, so there’s a significant buffer before any structural break can occur.
That brings us to the end of this week’s Market Overview.
Thank you for taking the time to read it, and I appreciate your support of my work!
As always, feel free to ask questions or leave comments below, or email me directly at nik@altcointradershandbook.com.


