

The price cycles of Bitcoin have consistently captivated the attention of both investors and analysts. By analyzing current trends alongside historical cycles, we can glean insights into possible future price movements. With Bitcoin seemingly nearing the conclusion of its consolidation phase, many are left wondering if a significant upward shift is imminent.
Analyzing Bitcoin Cycles
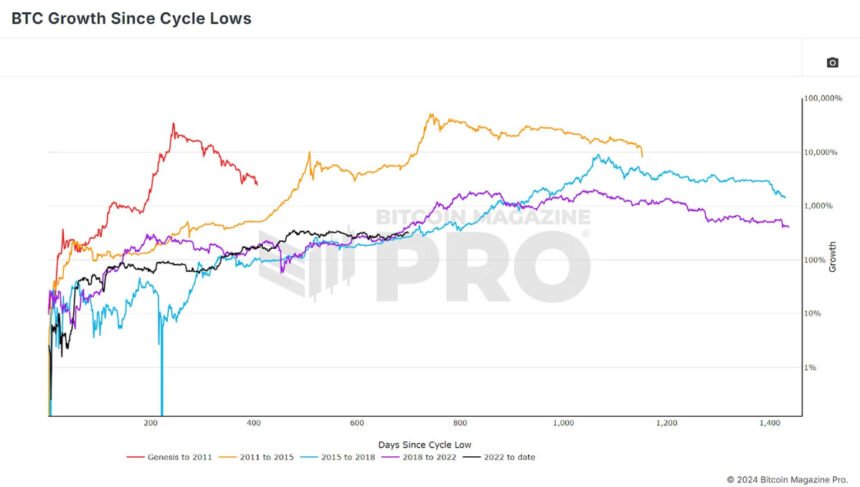
To start, it’s important to examine Bitcoin’s performance since it recently hit its cycle low. As we delve into the data, a clearer image emerges: Bitcoin’s current price trajectory (black line) exhibits patterns akin to prior bull cycles. Though this has been a turbulent consolidation phase, characterized by a mostly stagnant price, notable similarities arise when we draw comparisons to cycles from 2015-2018 (purple line) and 2018-2022 (blue line).
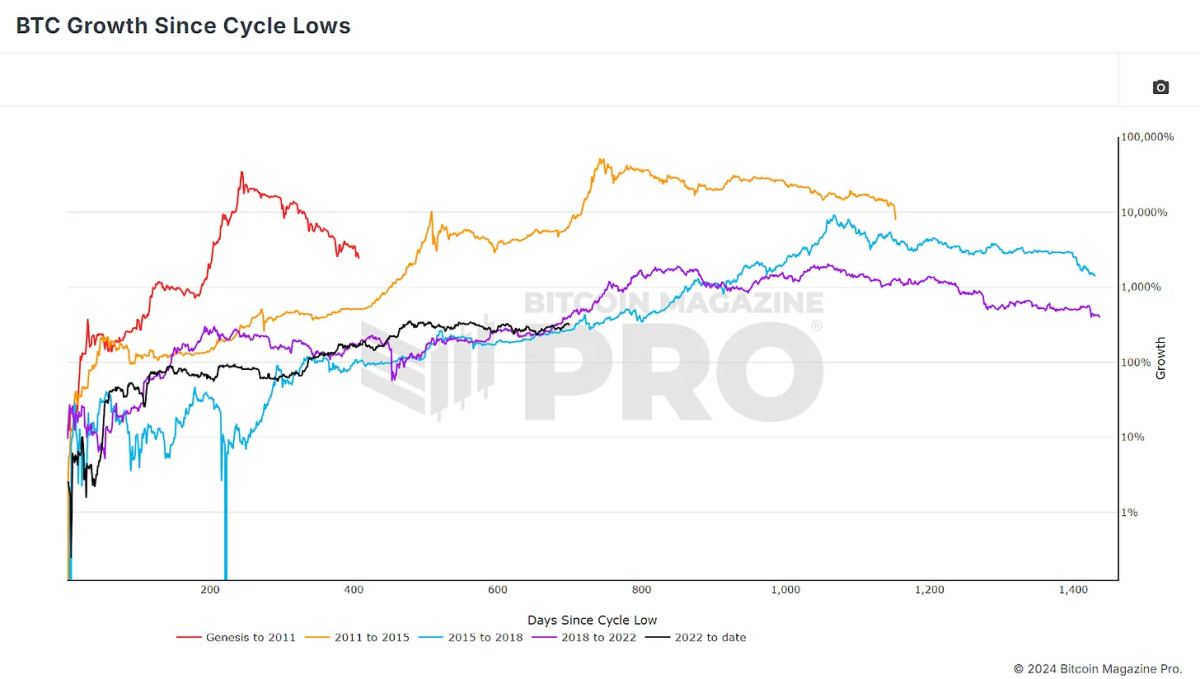

Currently, our percentage gains align closely with the cycles of 2018 and 2015. Yet, this analysis is only the beginning. An isolated focus on price action doesn’t present the complete picture; we should explore investor behavior and other metrics that influence the Bitcoin landscape.
Investor Sentiment
A pivotal metric revealing insights into investor sentiment is the MVRV Z-Score. This ratio compares Bitcoin’s current market price to its “realized price” (or cost basis), reflecting the average acquisition price for all Bitcoin in circulation. The Z-Score standardizes the raw MVRV data to account for BTC volatility, thus eliminating extreme outliers.
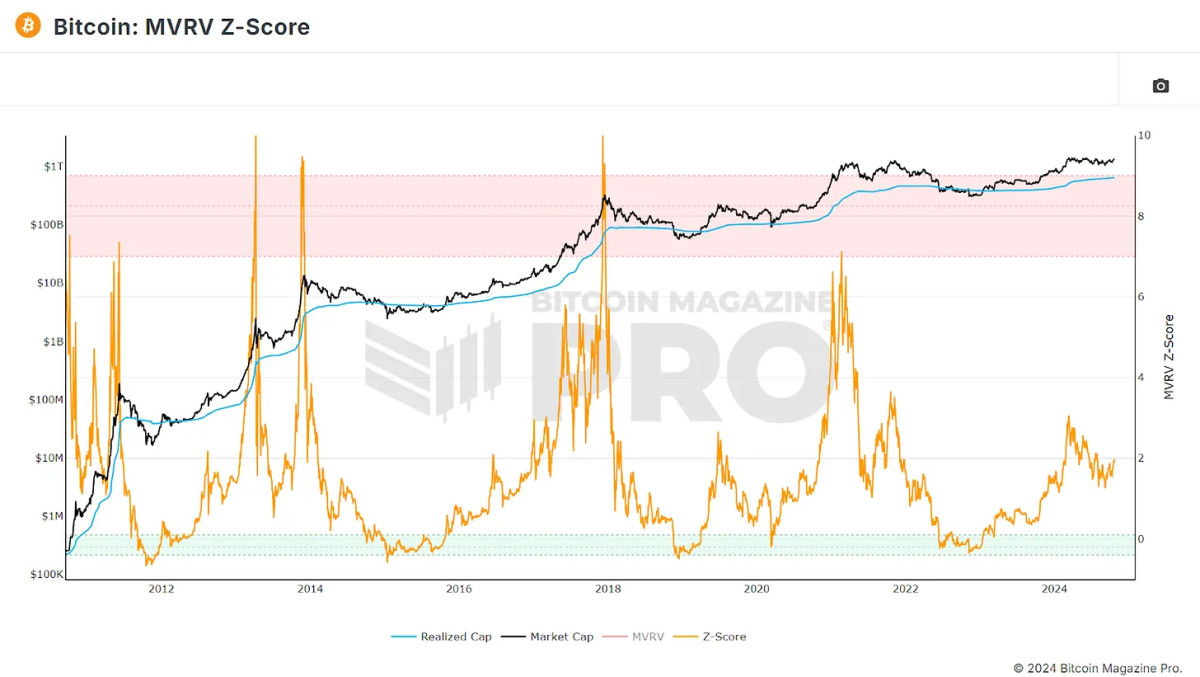
Examining metrics like this, beyond mere price movements, provides a deeper understanding of patterns and similarities in our existing cycle as compared to historical ones, encompassing not just dollar movements, but also shifts in investor habits and sentiment.
Connecting Price Movements
For a better grasp of how our current cycle corresponds with earlier ones, we utilize data from Bitcoin Magazine Pro, which delivers comprehensive insights via its API. By disregarding the Genesis cycle—due to its limited correlation—and focusing on price and MVRV data spanning Bitcoin’s lowest and highest closing points in our current and the last three cycles, we can observe distinct correlations.
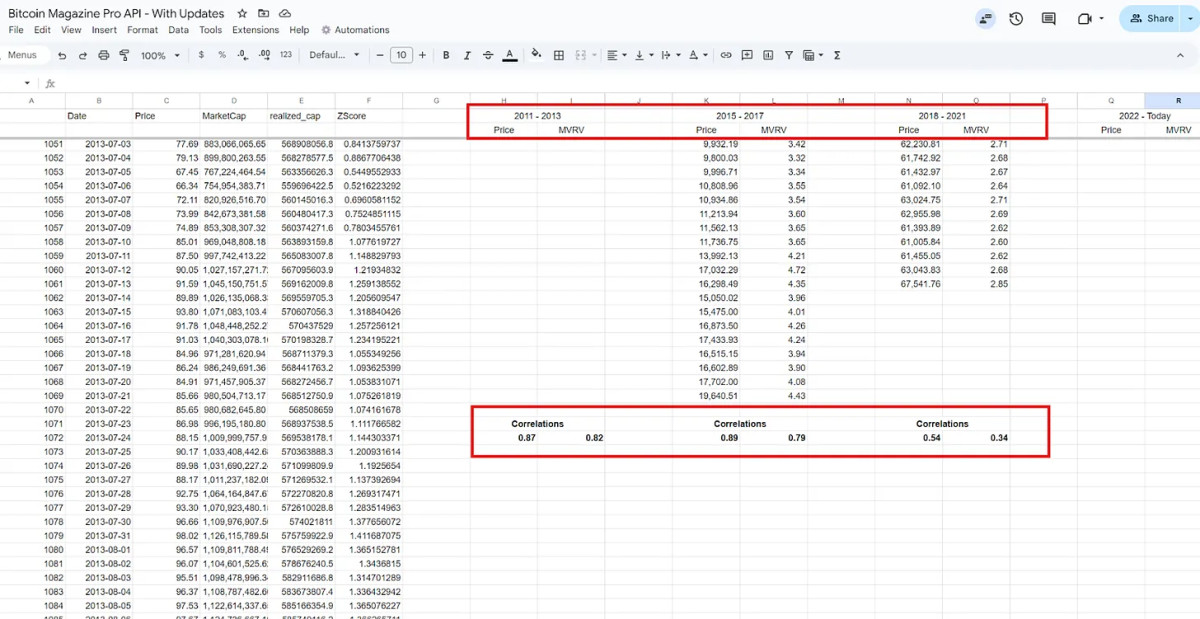
2011 to 2013 Cycle: This cycle, marked by its double peak, demonstrates a strong 87% correlation with current price action. Additionally, the MVRV ratio indicates a substantial 82% correlation, suggesting that while Bitcoin’s price exhibits similar behavior, investor actions regarding buying and selling align as well.
2015 to 2017 Cycle: Interestingly, this cycle has the closest price action correlation, standing at 89% compared to our current cycle. However, the MVRV ratio here is slightly lower, hinting at a potential divergence in investor behavior.
2018 to 2021 Cycle: This latest cycle, although positive, has the weakest correlation with current trends, suggesting that the market might not mirror patterns observed just a few years earlier.
Are We Heading Towards Another Double Peak?
The notable correlation with the 2011-2013 cycle is particularly significant. That period saw Bitcoin undergo a double peak, where the price surged to new all-time highs twice before entering an extended bear phase. Should Bitcoin replicate this pattern, we could soon witness impactful price movements. By overlaying the price action fractal from this era onto our present cycle and calibrating the returns, the similarities are immediately apparent.
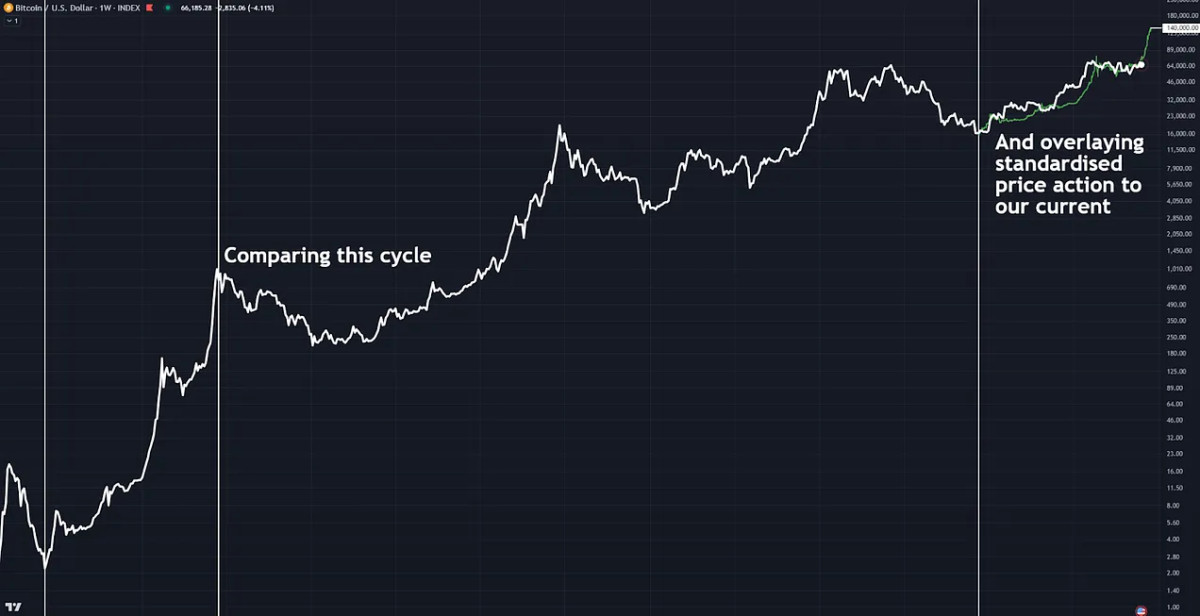
In previous instances, Bitcoin experienced a swift ascent to a new peak, followed by a lengthy, uneven consolidation phase. If history is any indication, we might be on the brink of a significant price surge, potentially reaching around $140,000 before the year’s end, factoring in diminishing returns.
Analyzing Investor Patterns
Another important metric to scrutinize is the Value Days Destroyed (VDD). This metric quantifies BTC transfers based on the volume moved and the time elapsed since the last transfer, multiplying this figure by the current price to shed light on long-term investors’ behavior, particularly regarding profit-taking.
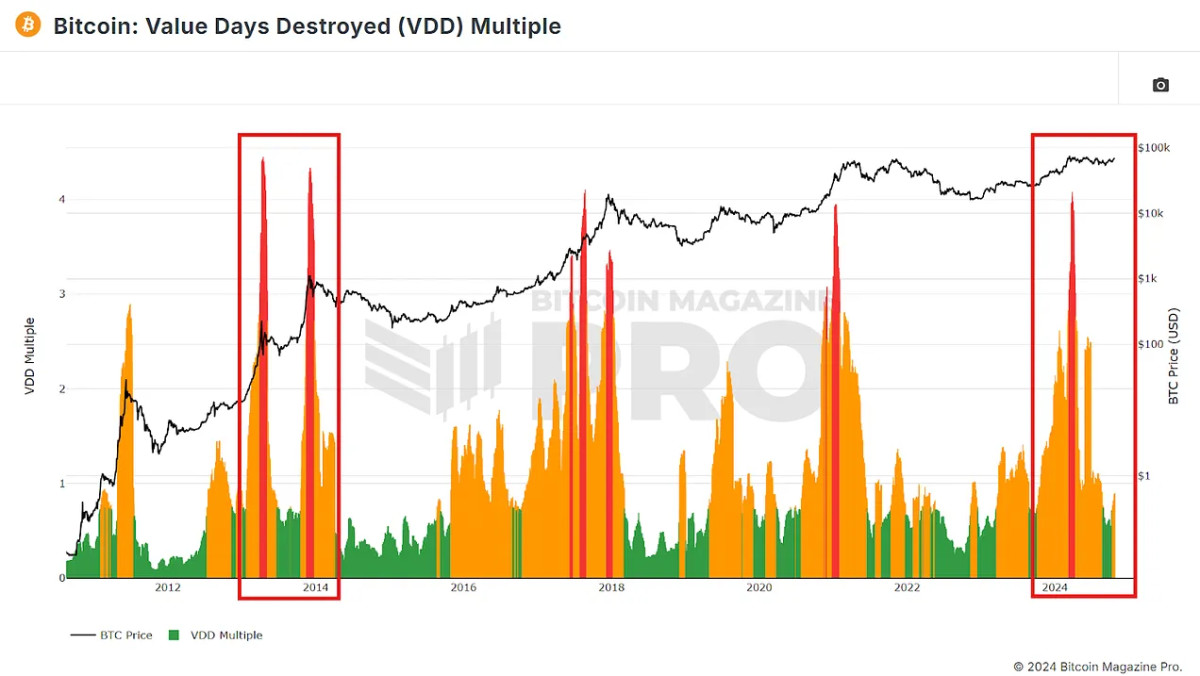
Currently, the VDD has exhibited an initial spike reminiscent of the red spikes noted during the 2013 double peak. This run-up, as BTC achieved a new all-time high earlier this year prior to a sustained consolidation phase, suggests that if this double peak cycle trend persists, we may soon reach fresh highs again.
Anticipating More Realistic Outcomes
With Bitcoin maturing as an asset, we have witnessed prolonged cycles and diminishing returns in our two most recent cycles compared to the first two. Thus, it’s more plausible for BTC to adhere to the cycle exhibiting the strongest price action correlation.
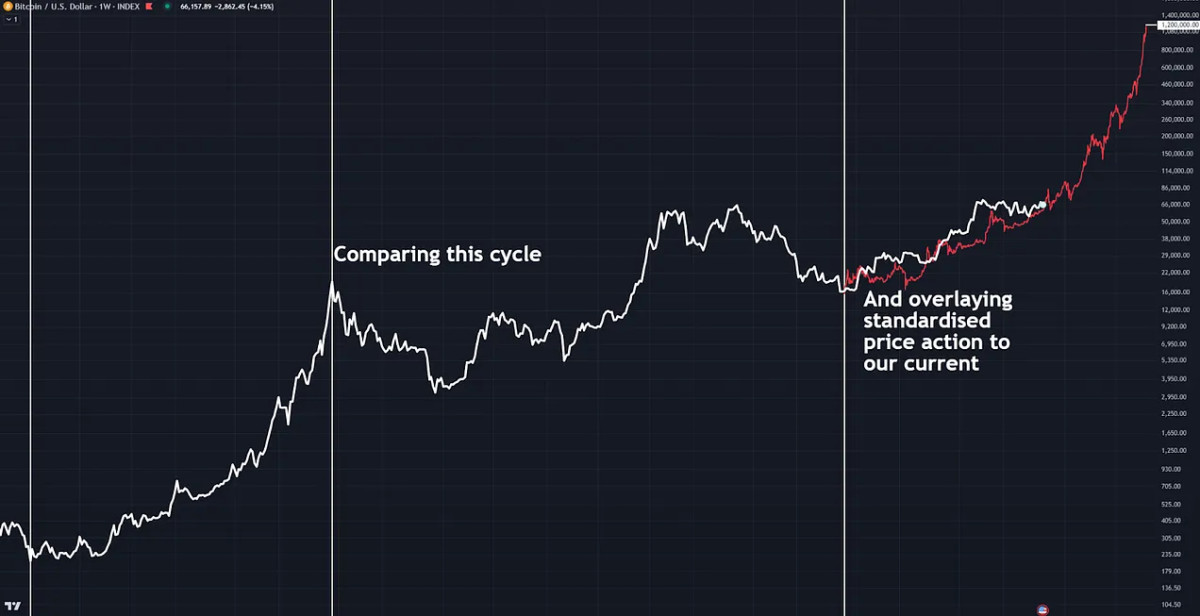
Figure 6: Overlaying a fractal of the 2017 cycle onto our current price action.
If Bitcoin mimics the 2015-2017 trajectory, it’s possible we could still see new all-time highs by late 2024. However, such a rally would likely unfold more gradually and sustainably, with a price target approximating $90,000 to $100,000 by early 2025. Following that, we might witness consistent growth throughout the year, culminating in a potential market peak by late 2025. Nonetheless, predicting a peak of $1.2 million under this exact pattern might be overly optimistic!
Final Thoughts
Historical evidence hints at an approaching turning point. Whether Bitcoin follows the explosive double-peak cycle observed from 2011-2013 or the steadier rise of 2015-2017, the outlook for Bitcoin appears positive. Paying attention to essential metrics like the MVRV ratio and Value Days Destroyed will offer further insights into the market’s direction, while analyzing correlations with past cycles can enhance our understanding of potential developments.
As Bitcoin stands ready for a breakout, be it in the coming weeks or into 2025, if BTC follows the trends of any previous cycles even remotely, investors should brace themselves for substantial price movements and possible new all-time highs in the near future.
For a deeper exploration of this subject, watch a recent YouTube video here: Comparing Bitcoin Bull Runs: Which Cycle Are We Following


 Dutch
Dutch English
 French
 German
 Greek
Greek Italian
 Portuguese
 Russian
 Spanish