


In his recent video titled “BITCOIN’S One Indicator Signaling LAST Major Dip,” Dan Gambardello, a prominent crypto analyst with 370,000 subscribers on YouTube, explores the recent price movements of Bitcoin to predict a possible final major dip. After plummeting to as low as $60,000 on Wednesday, the market is facing fears of an even more significant drop in Bitcoin’s value.
Why This Might Be Bitcoin’s Last Decline
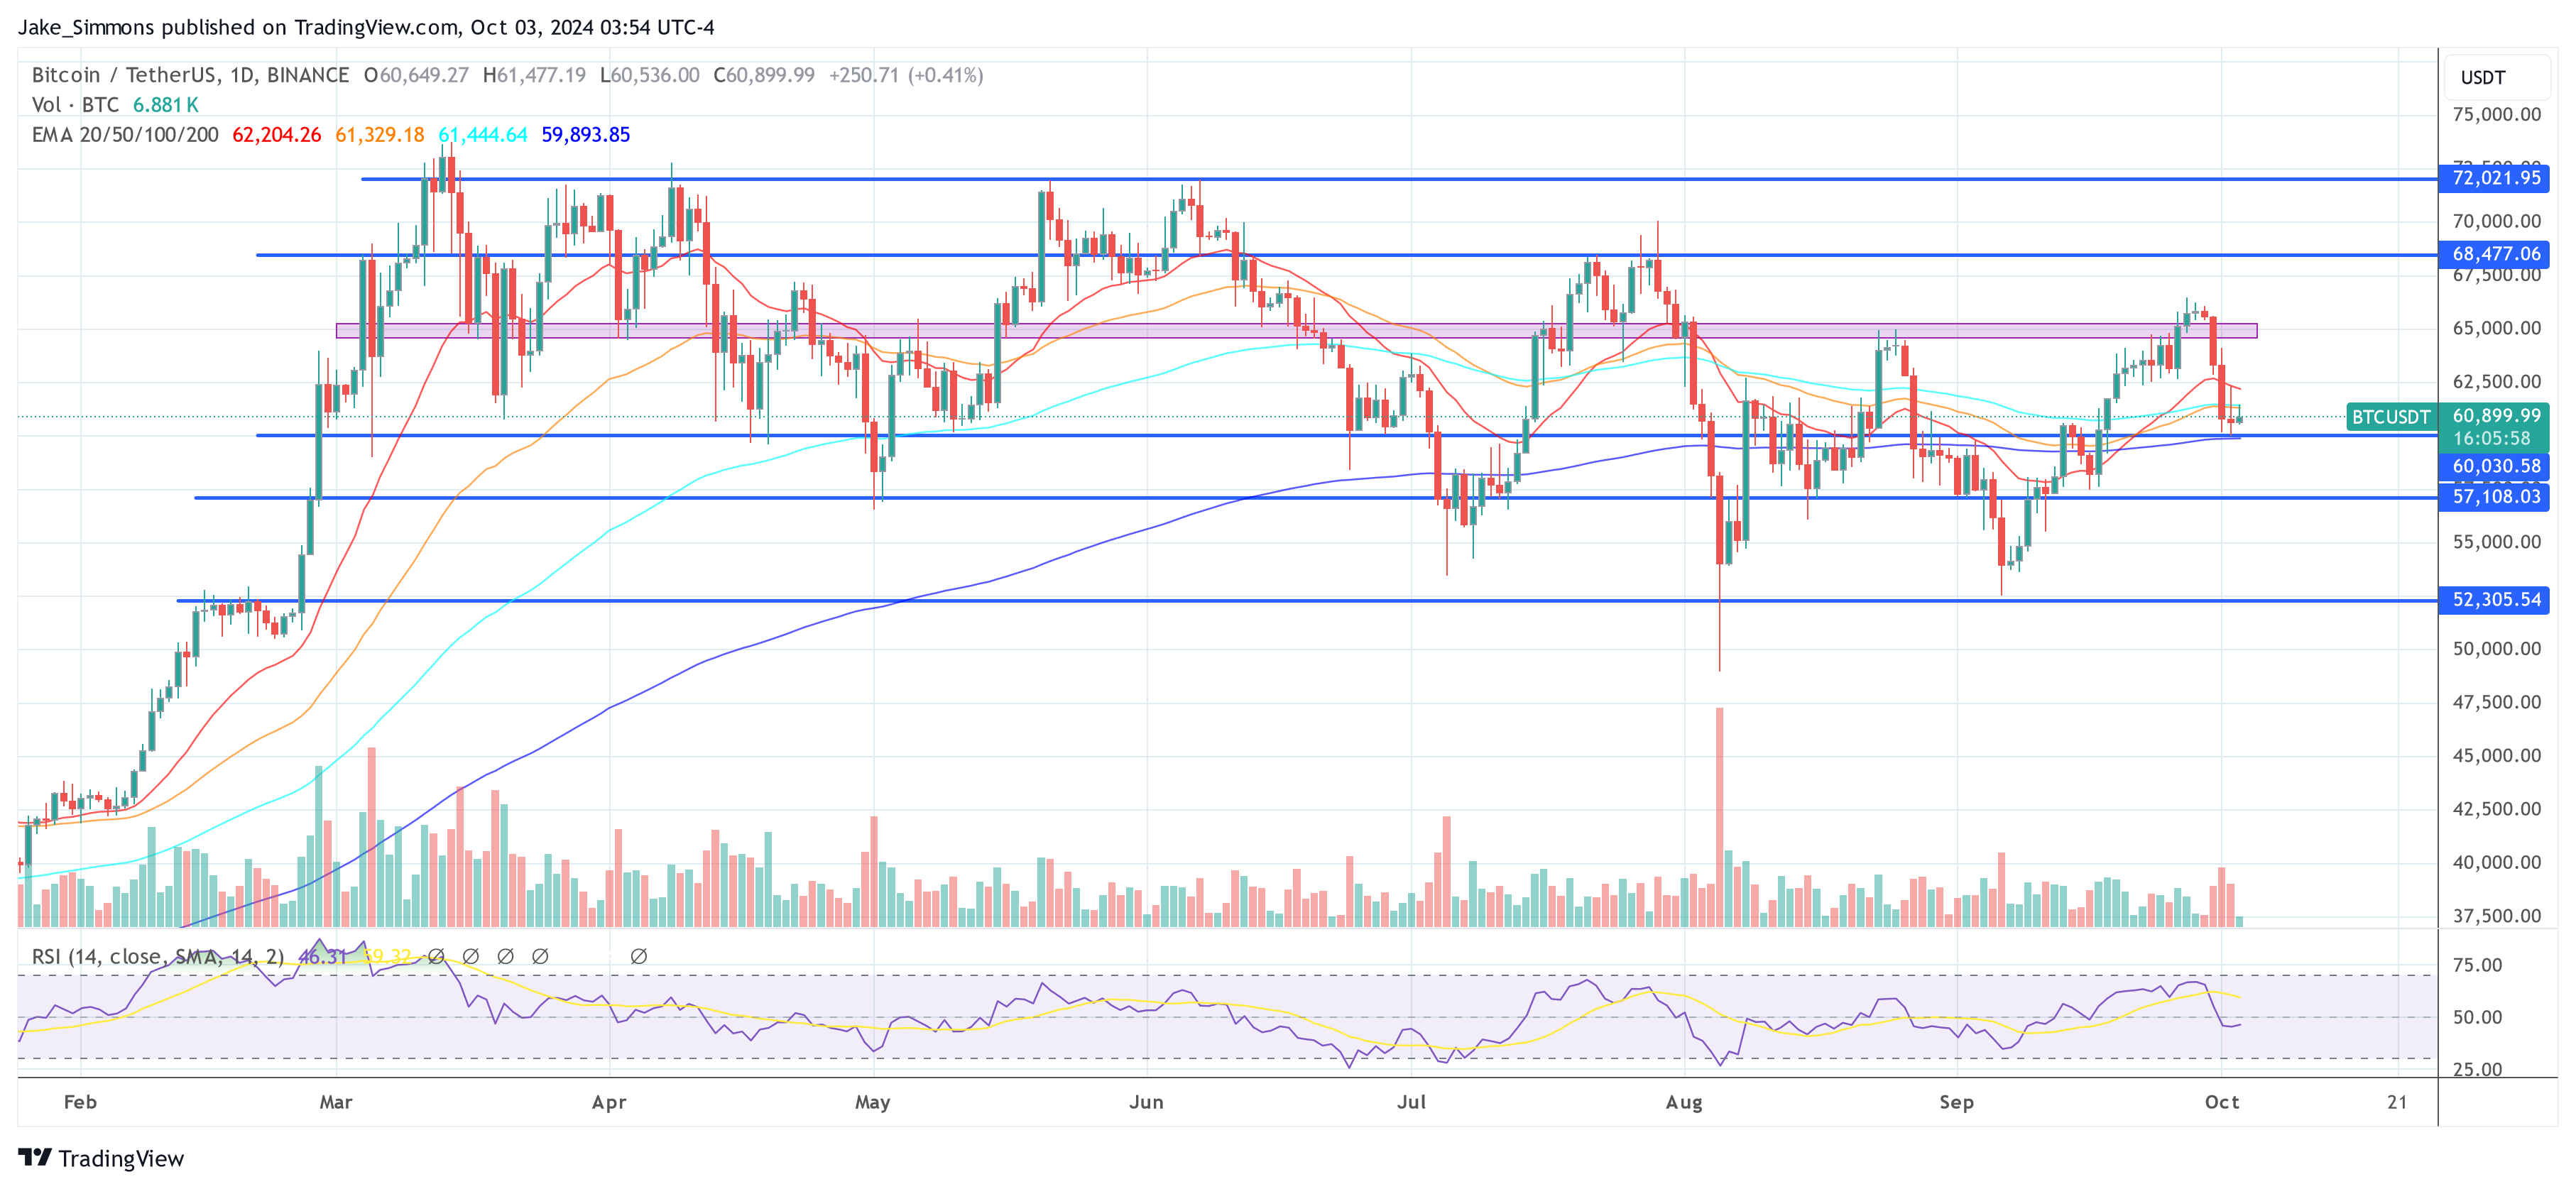
Gambardello points out the importance of the daily and six-hour technical charts. The daily chart shows Bitcoin currently testing the 50-day moving average, which often acts as a gauge for short-term market sentiment.
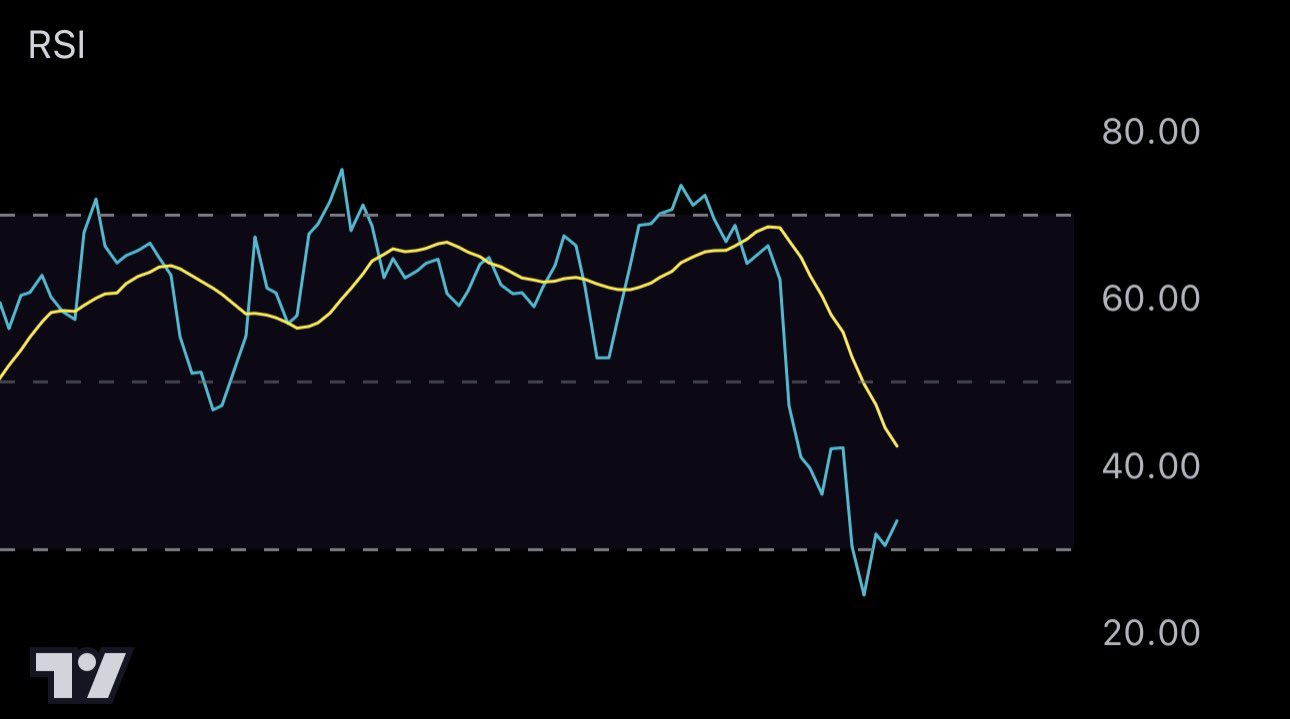
However, the analyst mainly concentrates on the six-hour chart’s Relative Strength Index (RSI), a momentum measurement tool that assesses the speed and variations in price movements, which has reached oversold levels. Gambardello believes that the RSI entering the oversold zone is typically seen as a positive indicator, suggesting an imminent end to the ongoing price drop.
Related Reading
“I think the bottom is quite near. There might be a brief capitulation in the very near term, but I believe a strong rebound could follow,” Gambardello remarked, indicating that despite the current market disturbances stemming from news related to the Israel-Iran conflict, the fundamentals suggest an eventual strong recovery.
On X, Gambardello mentioned, “Nothing compares to a 6-hour oversold RSI at the onset of a bull season. It also performs well during bull markets.”
This conclusion is based on Gambardello’s analysis of historical market trends under similar situations, highlighting the cyclical characteristics of Bitcoin’s market movements. By examining past data, he notes that Bitcoin often experiences declines at the start of October, followed by significant recoveries by the month’s end.
“October is going to finish in the green. It’s always like this after a dip. People are panicking, which is understandable, but this gives us some time. With these red candles heading into October, we might just need another week or two for a pump and a breakout upward to wrap up October,” Gambardello asserts.
Related Reading
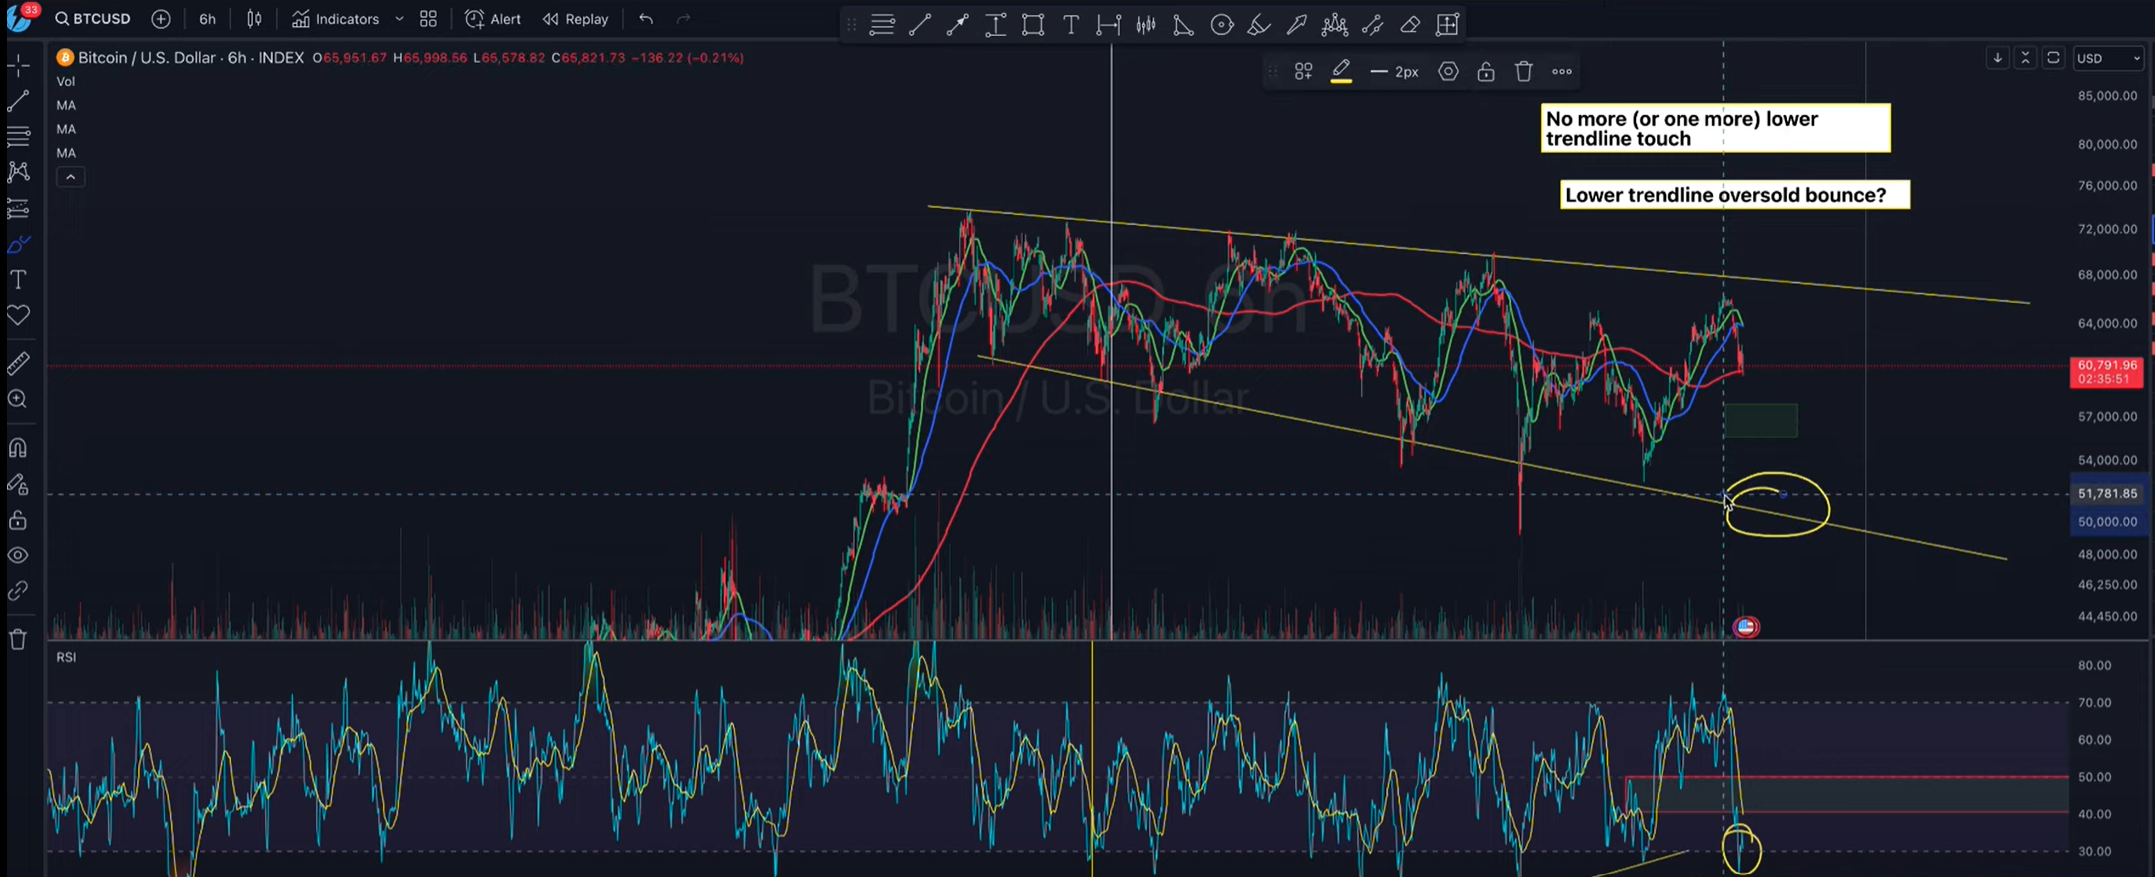
Delving further into the analysis, Gambardello discusses the potential scenarios surrounding Bitcoin’s lower trend line, which has proven to be a dependable support point over the last six months. He speculates that if Bitcoin revisits this trend line, it could effectively act as solid support, possibly signaling the last major downturn before an upward trajectory.
Interestingly, one final touch on the trendline could bring Bitcoin’s price down to approximately $50,000. However, Gambardello considers this less probable since the 6-hour RSI is already in the oversold zone, while Bitcoin is rebounding from the 50-day moving average.
Moreover, Gambardello touches on Bitcoin’s behavior during previous halving years, which generally lead to bull markets, as observed in 2016 and 2020. He suggests that this year could follow a similar path. “This is a Halving year. We’ve witnessed what happened in halving years during October in 2016 and 2020. Will history repeat itself?”
At the time of writing, Bitcoin was trading at $60,899.
Featured image generated using DALL.E, chart sourced from TradingView.com


 Dutch
Dutch English
 French
 German
 Greek
Greek Italian
 Portuguese
 Russian
 Spanish