


Helium (HNT) has seen an upward trend in its price, even amidst a general market decline. What might be causing this? While HNT is currently moving upwards, various indicators imply that the strength of this trend may not be as robust as it appears.
The ADX shows a weakening trend, and although the RSI points to the possibility of further increases, the low momentum raises concerns about the sustainability of the uptrend.
HNT ADX Indicates the Current Trend Is Weak
HNT’s ADX has significantly fallen to 13.28, down from a strong level of 40 on September 18, indicating a substantial decline in the strength of the current trend.
The ADX (Average Directional Index) is a technical indicator that assesses the strength of a trend, irrespective of its direction. Typically, an ADX reading above 25 signifies a strong trend likely to persist, while values below 20 suggest a weak or nonexistent trend.
Read more: Helium (HNT) Price Prediction 2024/2025/2030
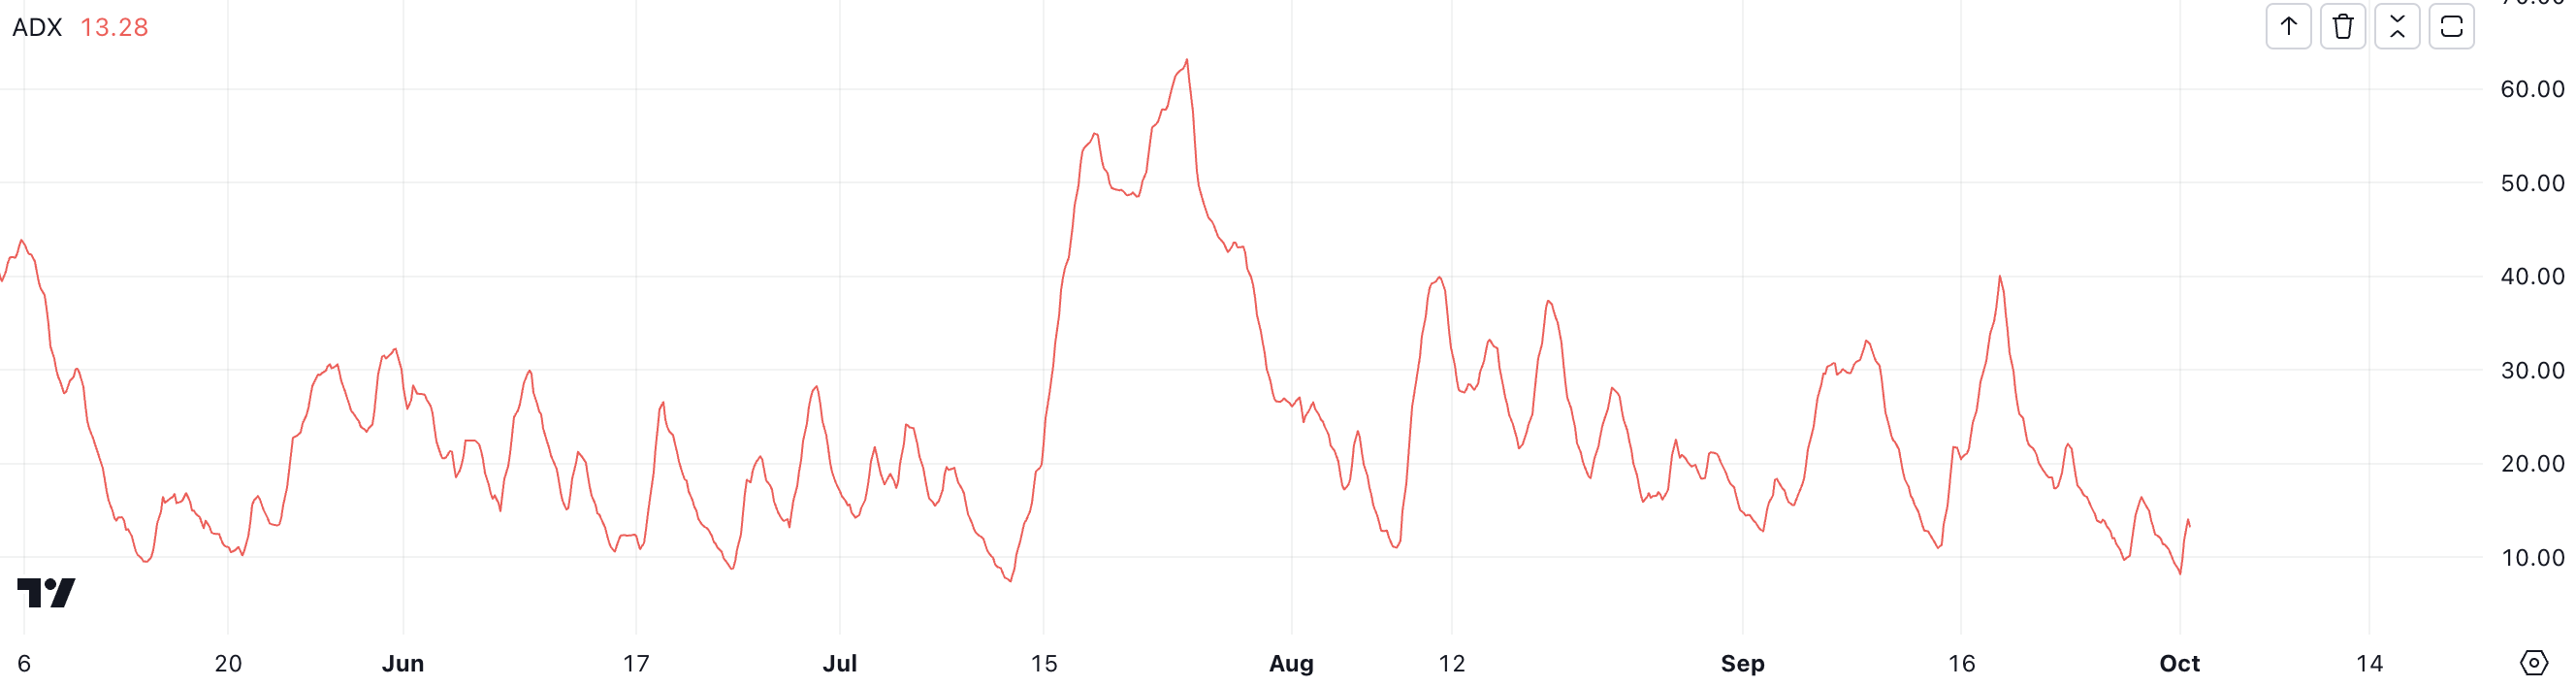
With HNT’s ADX now significantly below the 20 mark, it indicates a lack of momentum in the present price movements. Even though HNT remains in an uptrend, the low ADX suggests that this trend lacks the strength needed for continuation.
This decline in strength could lead to a trend reversal in the short term, making the price more vulnerable to selling pressure or changes in market sentiment. A declining ADX in this range signals that traders should approach with caution, as the uptrend might not endure if momentum keeps diminishing.
Helium RSI Indicates Potential for Price Increase
Currently, HNT’s RSI stands at 50.21, reflecting a neutral position regarding market momentum. This means the price is neither in an overbought nor oversold state. The RSI (Relative Strength Index) serves as a technical tool to help traders evaluate the speed and changes in price by comparing the magnitude of recent gains to recent losses.
The RSI fluctuates between 0 and 100; readings above 70 signify potential overbought conditions where a price correction could be imminent, while readings below 30 indicate oversold conditions where a rebound may be anticipated.
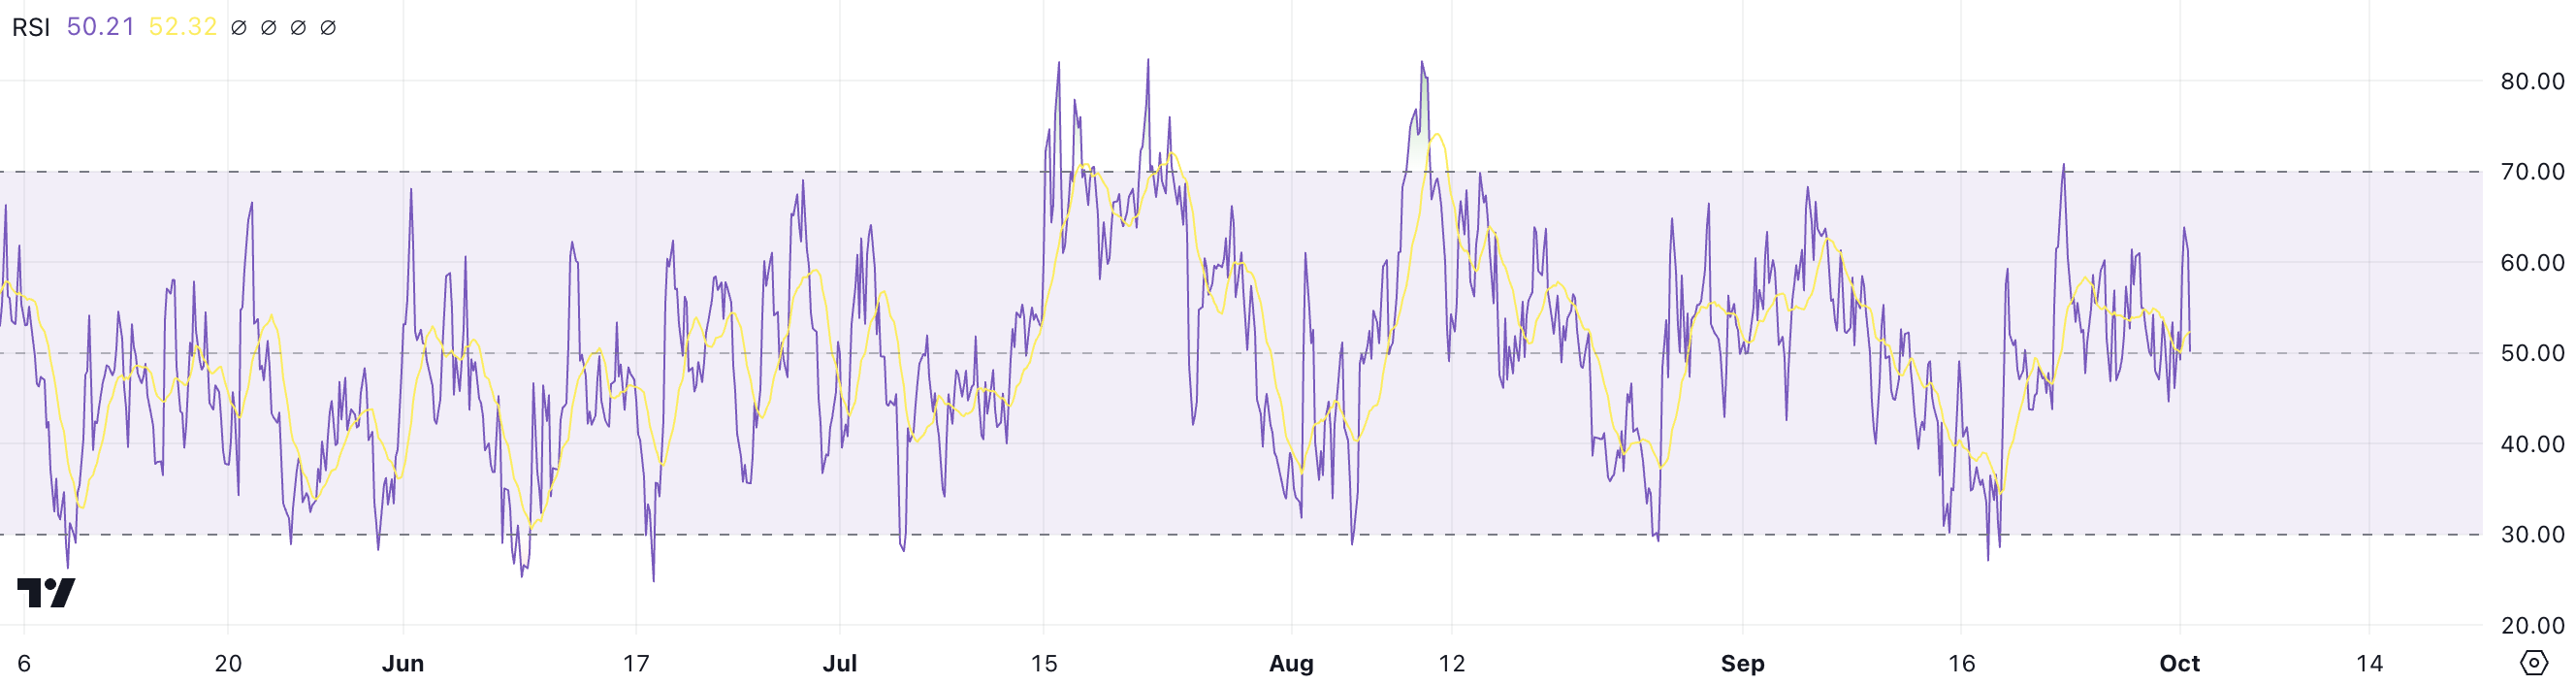
With HNT’s RSI hovering just above 50, the token is situated in a balanced territory, suggesting there isn’t strong pressure from either buyers or sellers at this time. This situation allows for the possibility of further price increases, as the RSI has not yet reached levels that would indicate an overheated market.
Considering HNT has already experienced a gain of 3.05% over the past week, making it one of the strongest performers in the DePin sector, the current RSI hints that additional price growth could be on the horizon.
However, while the RSI indicates potential price increases, the ADX reveals that the current trend lacks sufficient strength. The interplay between these two elements is crucial for forecasting HNT’s next price movements.
HNT Price Prediction: Major Resistance at $8
HNT’s EMA lines are currently aligned in a bullish pattern, having achieved a golden cross on September 23. A golden cross occurs when a short-term EMA rises above a long-term EMA, suggesting the potential for a sustained upward trend.
Nonetheless, despite this encouraging setup, the proximity of the EMA lines remains relatively narrow, indicating that the trend has not yet fully developed or strengthened.
The Exponential Moving Average (EMA) is a technique that monitors an asset’s average price over time, assigning greater importance to more recent price changes. This makes it more responsive to price fluctuations compared to a simple moving average.
Read more: What Is DePIN (Decentralized Physical Infrastructure Networks)?
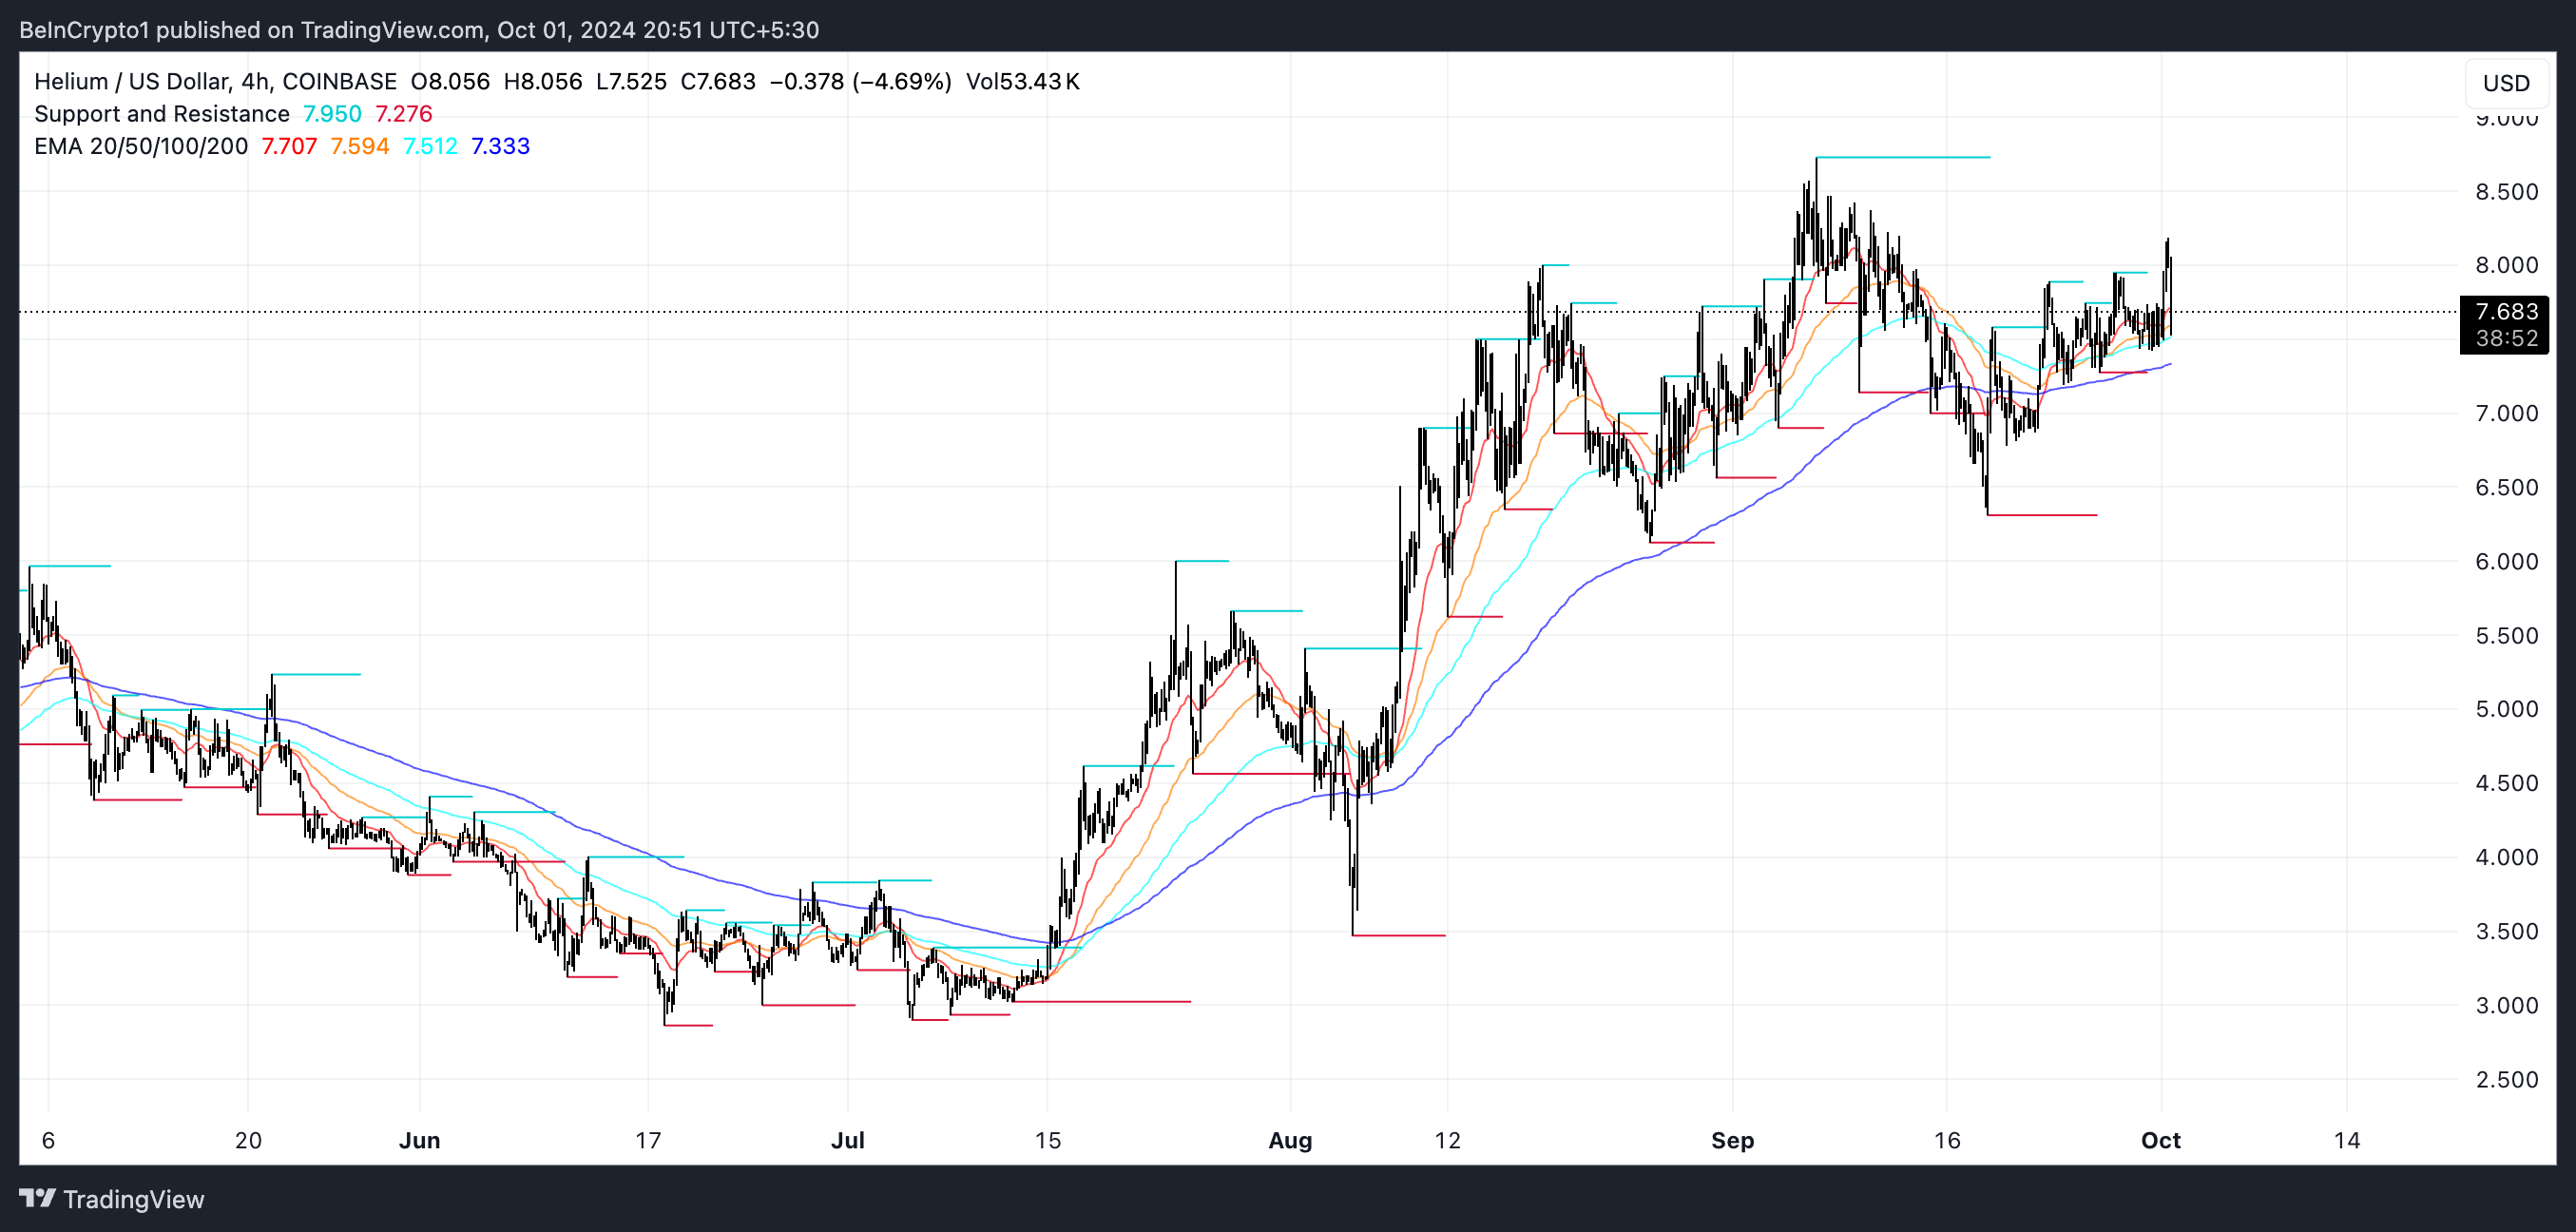
While the current EMA configuration suggests bullish potential, HNT has encountered resistance at the $8.00 level, struggling to surpass this critical barrier. Should it succeed in breaking through, it could rise to $8.70, representing a potential 10% gain.
However, with the ADX indicating a feeble trend, there is a genuine risk that the momentum may dissipate, potentially causing the uptrend to reverse. If such a reversal occurs, HNT’s price could plummet to around $6.30, marking a significant 20% decline.
Disclaimer
In accordance with the Trust Project guidelines, this price analysis is intended for informational purposes only and should not serve as financial or investment advice. BeInCrypto strives for accurate and impartial reporting, but market conditions may change without notice. Always perform your own research and consult with a professional prior to making any financial decisions. Please note that our Terms and Conditions, Privacy Policy, and Disclaimers have been updated.


 Dutch
Dutch English
 French
 German
 Greek
Greek Italian
 Portuguese
 Russian
 Spanish