


Recent trends in Ethereum’s price saw ETH dip to $2,150 on September 6, sparking fears of a more drastic drop towards the $2,000 threshold. However, these worries subsided following a recovery to $2,460 on September 13, yet Ethereum continues to trend downward, as a triple-bottom price pattern begins to emerge.
Interestingly, this pattern is not unprecedented for Ethereum. Technical analysis suggests that the current price movements echo a similar situation from mid-2021.
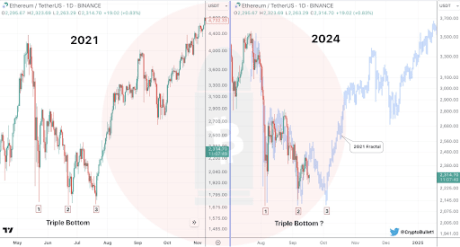
Ethereum Fractal Indicates Q4 Rally
As outlined in a technical analysis by crypto analyst CryptoBullet on the social media platform X, Ethereum appears to be forming a triple bottom on the 1D candlestick timeframe. Although the third bottom is still in process, the analyst draws attention to a comparable pattern observed between June and August 2021.
Related Reading
Throughout those three months, Ethereum’s price fluctuated, establishing three distinct lows just above the $1,675 level. After the third low, Ethereum saw a significant bullish rally that allowed it to break its previous all-time high. This upward trend became more pronounced when a fractal pattern appeared in August 2021, indicating a strong momentum shift.
Recent trends have driven Ethereum to create two lows around $2,150 in August and September. Furthermore, a recent rejection at the $2,450 resistance level has led Ethereum to experience a downward push. Analyst CryptoBullet has pointed out the potential for a third low in October, completing the triple bottom formation.
Price patterns in cryptocurrency markets tend to repeat, often following recognizable sequences that can help traders predict future movements. Although market conditions are never identical, analyzing previous price behaviors offers important insights into potential future outcomes. A repeat of the 2021 price movement could lead to a significant surge for Ethereum in Q4 2024, with the analyst forecasting a rally toward the $3,700 mark.
What Lies Ahead for ETH?
As of this writing, Ethereum is priced at $2,320 and continues to exhibit a lackluster short-term outlook. If Ethereum cannot surpass the $2,340 resistance, it may enter a new decline toward $2,150.
Related Reading
This disappointing performance is particularly stark in comparison to Bitcoin. Consequently, the Ethereum/Bitcoin ratio is now at its lowest point since April 2021, marking a significant 41-month low. Much of this underwhelming activity has been driven by sell-offs from a few major holders. For example, Ethereum co-founder Vitalik Buterin recently faced scrutiny for selling $2.2 million worth of Ethereum.
Featured image created with Dall.E, chart from Tradingview.com


 Dutch
Dutch English
 French
 German
 Greek
Greek Italian
 Portuguese
 Russian
 Spanish