


The recent price movements for FET suggest a bearish outlook, with the Relative Strength Index (RSI) indicating the possibility of continued declines. As the RSI remains entrenched in bearish territory, it appears that momentum is leaning towards sellers, raising the risk of a more substantial downturn.
Amid the sharpening downward pressure, focus is shifting to the critical support level at $0.9. Sustaining this level is vital to mitigating further losses, as a failure to hold could trigger more significant declines.
Considering the prevailing market sentiment, which points towards the potential for additional losses, this article seeks to delve into the ongoing bearish trend in FET, emphasizing how the RSI reflects heightened bearish pressure. Through an assessment of essential technical indicators and market dynamics, this analysis will investigate whether FET is likely to encounter further downturns or if any support levels might spur a recovery.
RSI Indicates Increasing Downside Momentum for FET
FET has recently entered bearish territory on the 4-hour chart, dipping below the 100-day Simple Moving Average (SMA) and approaching the pivotal $0.9 support level. This drop beneath the 100-day SMA signifies weakening momentum and suggests that sellers are taking control of the market.
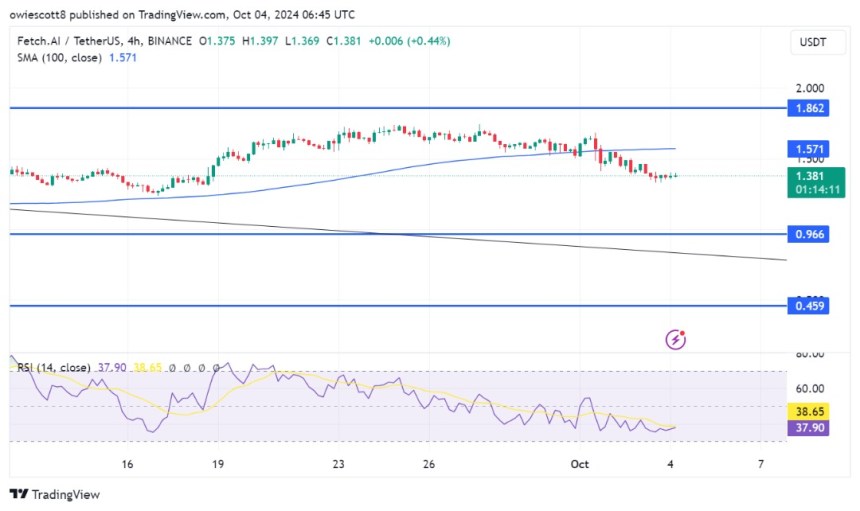
Examining the 4-hour Relative Strength Index reveals that the signal line has fallen below 50%, currently resting at 37%, indicating heightened selling pressure and a decline in buying interest. With the RSI in this position, it points to the potential for further downside movement in FET, suggesting a significant lack of bullish conviction in the market.
Moreover, the daily chart for FET also indicates negative momentum after recent attempts to breach the $1.8 resistance level were unsuccessful. This struggle is marked by the presence of several bearish candlesticks, indicating ongoing selling pressure. Despite the price remaining above the 100-day SMA, traditionally a bullish indicator, the failure to surpass the $1.8 resistance suggests waning bullish strength, putting FET at risk for prolonged losses.
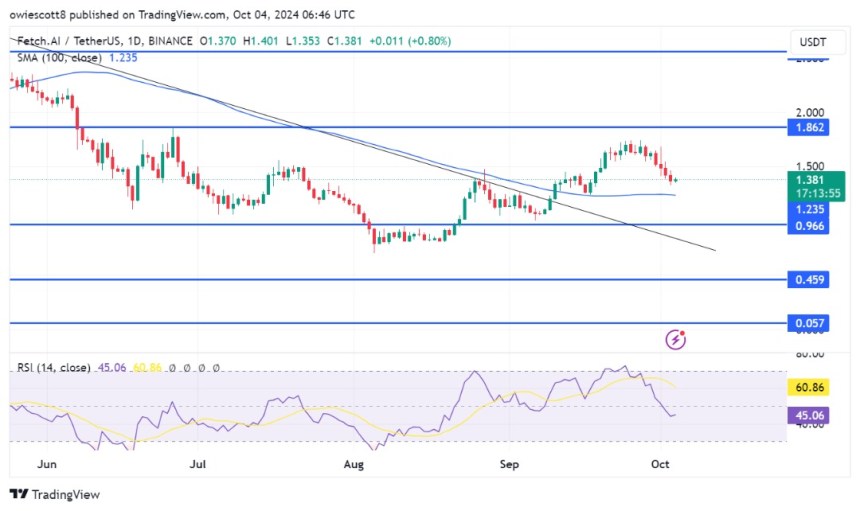
A detailed review of the RSI formation on the 1-day chart shows that the RSI signal line has decreased to 44%, recently dipping beneath the critical 50% level. Typically, an RSI reading below 50 indicates bearish sentiment, signaling that the asset may be losing momentum. Such a drop could foreshadow deeper corrections for FET unless a reversal occurs.
Crucial Support Levels to Monitor Amid Bearish Sentiment
With the market’s bearish sentiment, the $0.9 support level has become particularly significant for FET. A drop below this threshold could lead to intensified selling pressure, potentially pushing the price down towards the $0.4 support area and further.
If FET can sustain its strength and remain above the $0.9 support level, it may create opportunities for a rebound, enabling the price to drift back toward the $1.8 resistance zone. A successful breakout above this critical resistance level could ignite a wave of buying activity, resulting in further gains as bullish momentum accumulates. Monitoring FET’s response to these levels will be key, as they will indicate whether a recovery is on the horizon or if bearish pressure will dominate.


 Dutch
Dutch English
 French
 German
 Greek
Greek Italian
 Portuguese
 Russian
 Spanish