


- The Ethereum symmetrical triangle pattern may signal a bottom formation, with the possibility of further declines before a rebound.
- The rising leverage ratio and varying open interest volumes indicate notable market dynamics.
Recently, Ethereum [ETH] has faced considerable volatility, experiencing a price drop of 10.8% over the past week. After a robust rally that saw the asset exceed $2,700 in an attempt to reclaim the $3,000 threshold, the market corrected, pushing Ethereum lower.
Currently, Ethereum is showing signs of recovery, rallying by approximately 2.4% in the last day to trade at about $2,389. This recent price action has sparked speculation about the asset’s upcoming trajectory.
Potential decline before a breakout
Prominent crypto analyst Trader Tardigrade recently shared insights regarding Ethereum’s possible price developments on X.
The analyst indicates that Ethereum could be forming a “Symmetrical Triangle Bottom,” a technical pattern that may indicate a potential reversal.
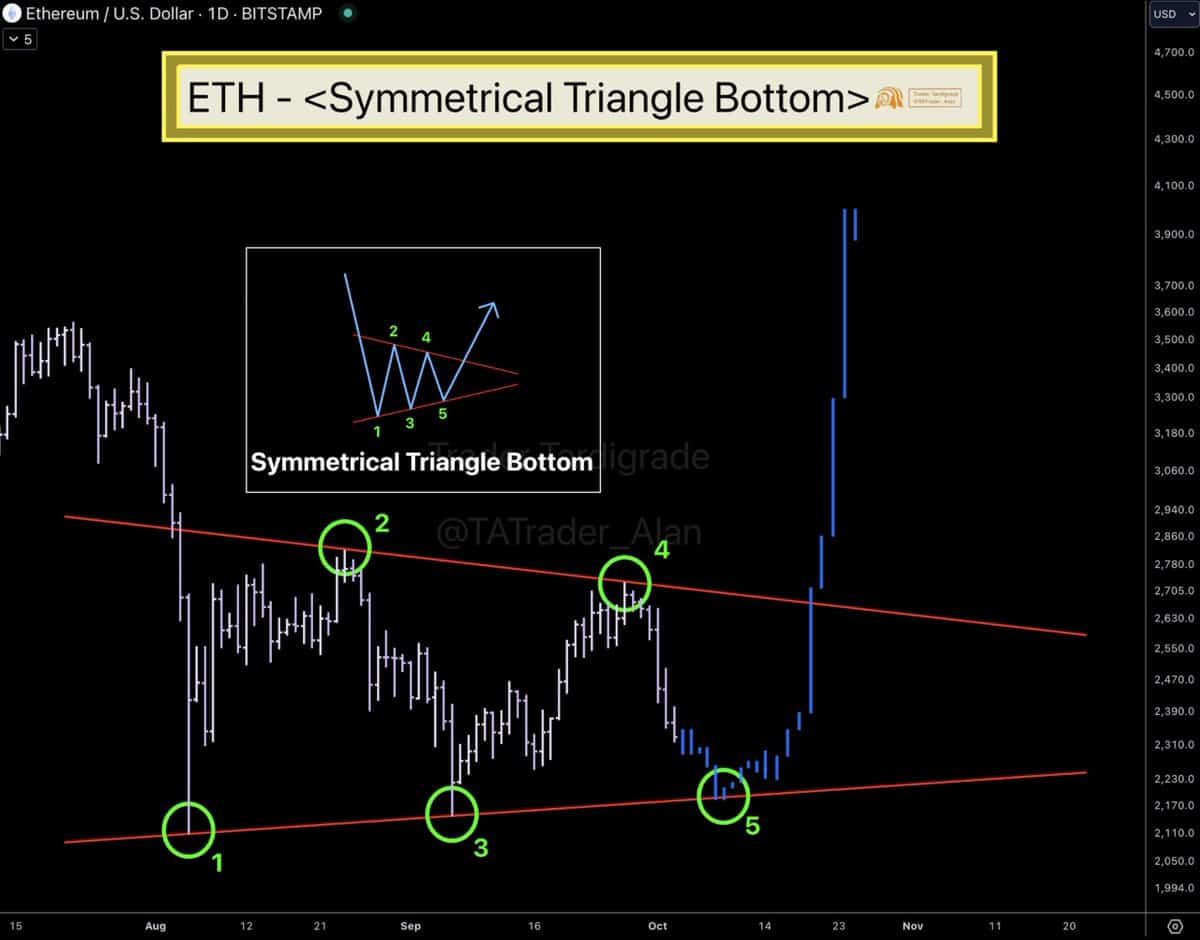
Source: Trader Tardigrade
However, the analyst warns that ETH may need to dip lower before any substantial upward momentum occurs.
He noted, “It’s possible that ETH hits the lower support level as the fifth leg before finalizing the bottom formation,” indicating a likely pullback prior to the completion of this pattern.
In technical analysis, a symmetrical triangle pattern is characterized by price consolidating within a narrowing range over time, resulting in a shape resembling a triangle.
This formation often signifies market indecision, as buyers and sellers vie for control. The symmetrical triangle typically features a sequence of lower highs and higher lows converging at a point known as the apex.
When this pattern concludes, it frequently results in a breakout in either direction, signaling the initiation of a new trend.
In the case of Ethereum, the observed symmetrical triangle pattern suggests a phase of consolidation before a decisive breakout. Should the triangle formation unfold as the analyst predicts, Ethereum could experience a significant price increase following a touch at its lower support.
Key Ethereum metrics point to significant market shifts
Aside from technical patterns, it’s essential to examine Ethereum’s market fundamentals, which provide wider context for its price movements.
One critical metric to watch is the “Estimated Leverage Ratio,” which indicates the level of leverage utilized in the Ethereum market.
This ratio is calculated by dividing open interest (the total number of outstanding derivative contracts) by the reserves of an asset on exchanges. A high leverage ratio signals increased speculative trading, implying that traders are leveraging to enhance their positions.
As of now, according to data from CryptoQuant, the estimated leverage ratio for Ethereum has increased from 0.341 at the end of the previous month to 0.366. This rise signifies that traders are increasingly engaging in leveraged trades, which may indicate elevated risk and volatility within the market.
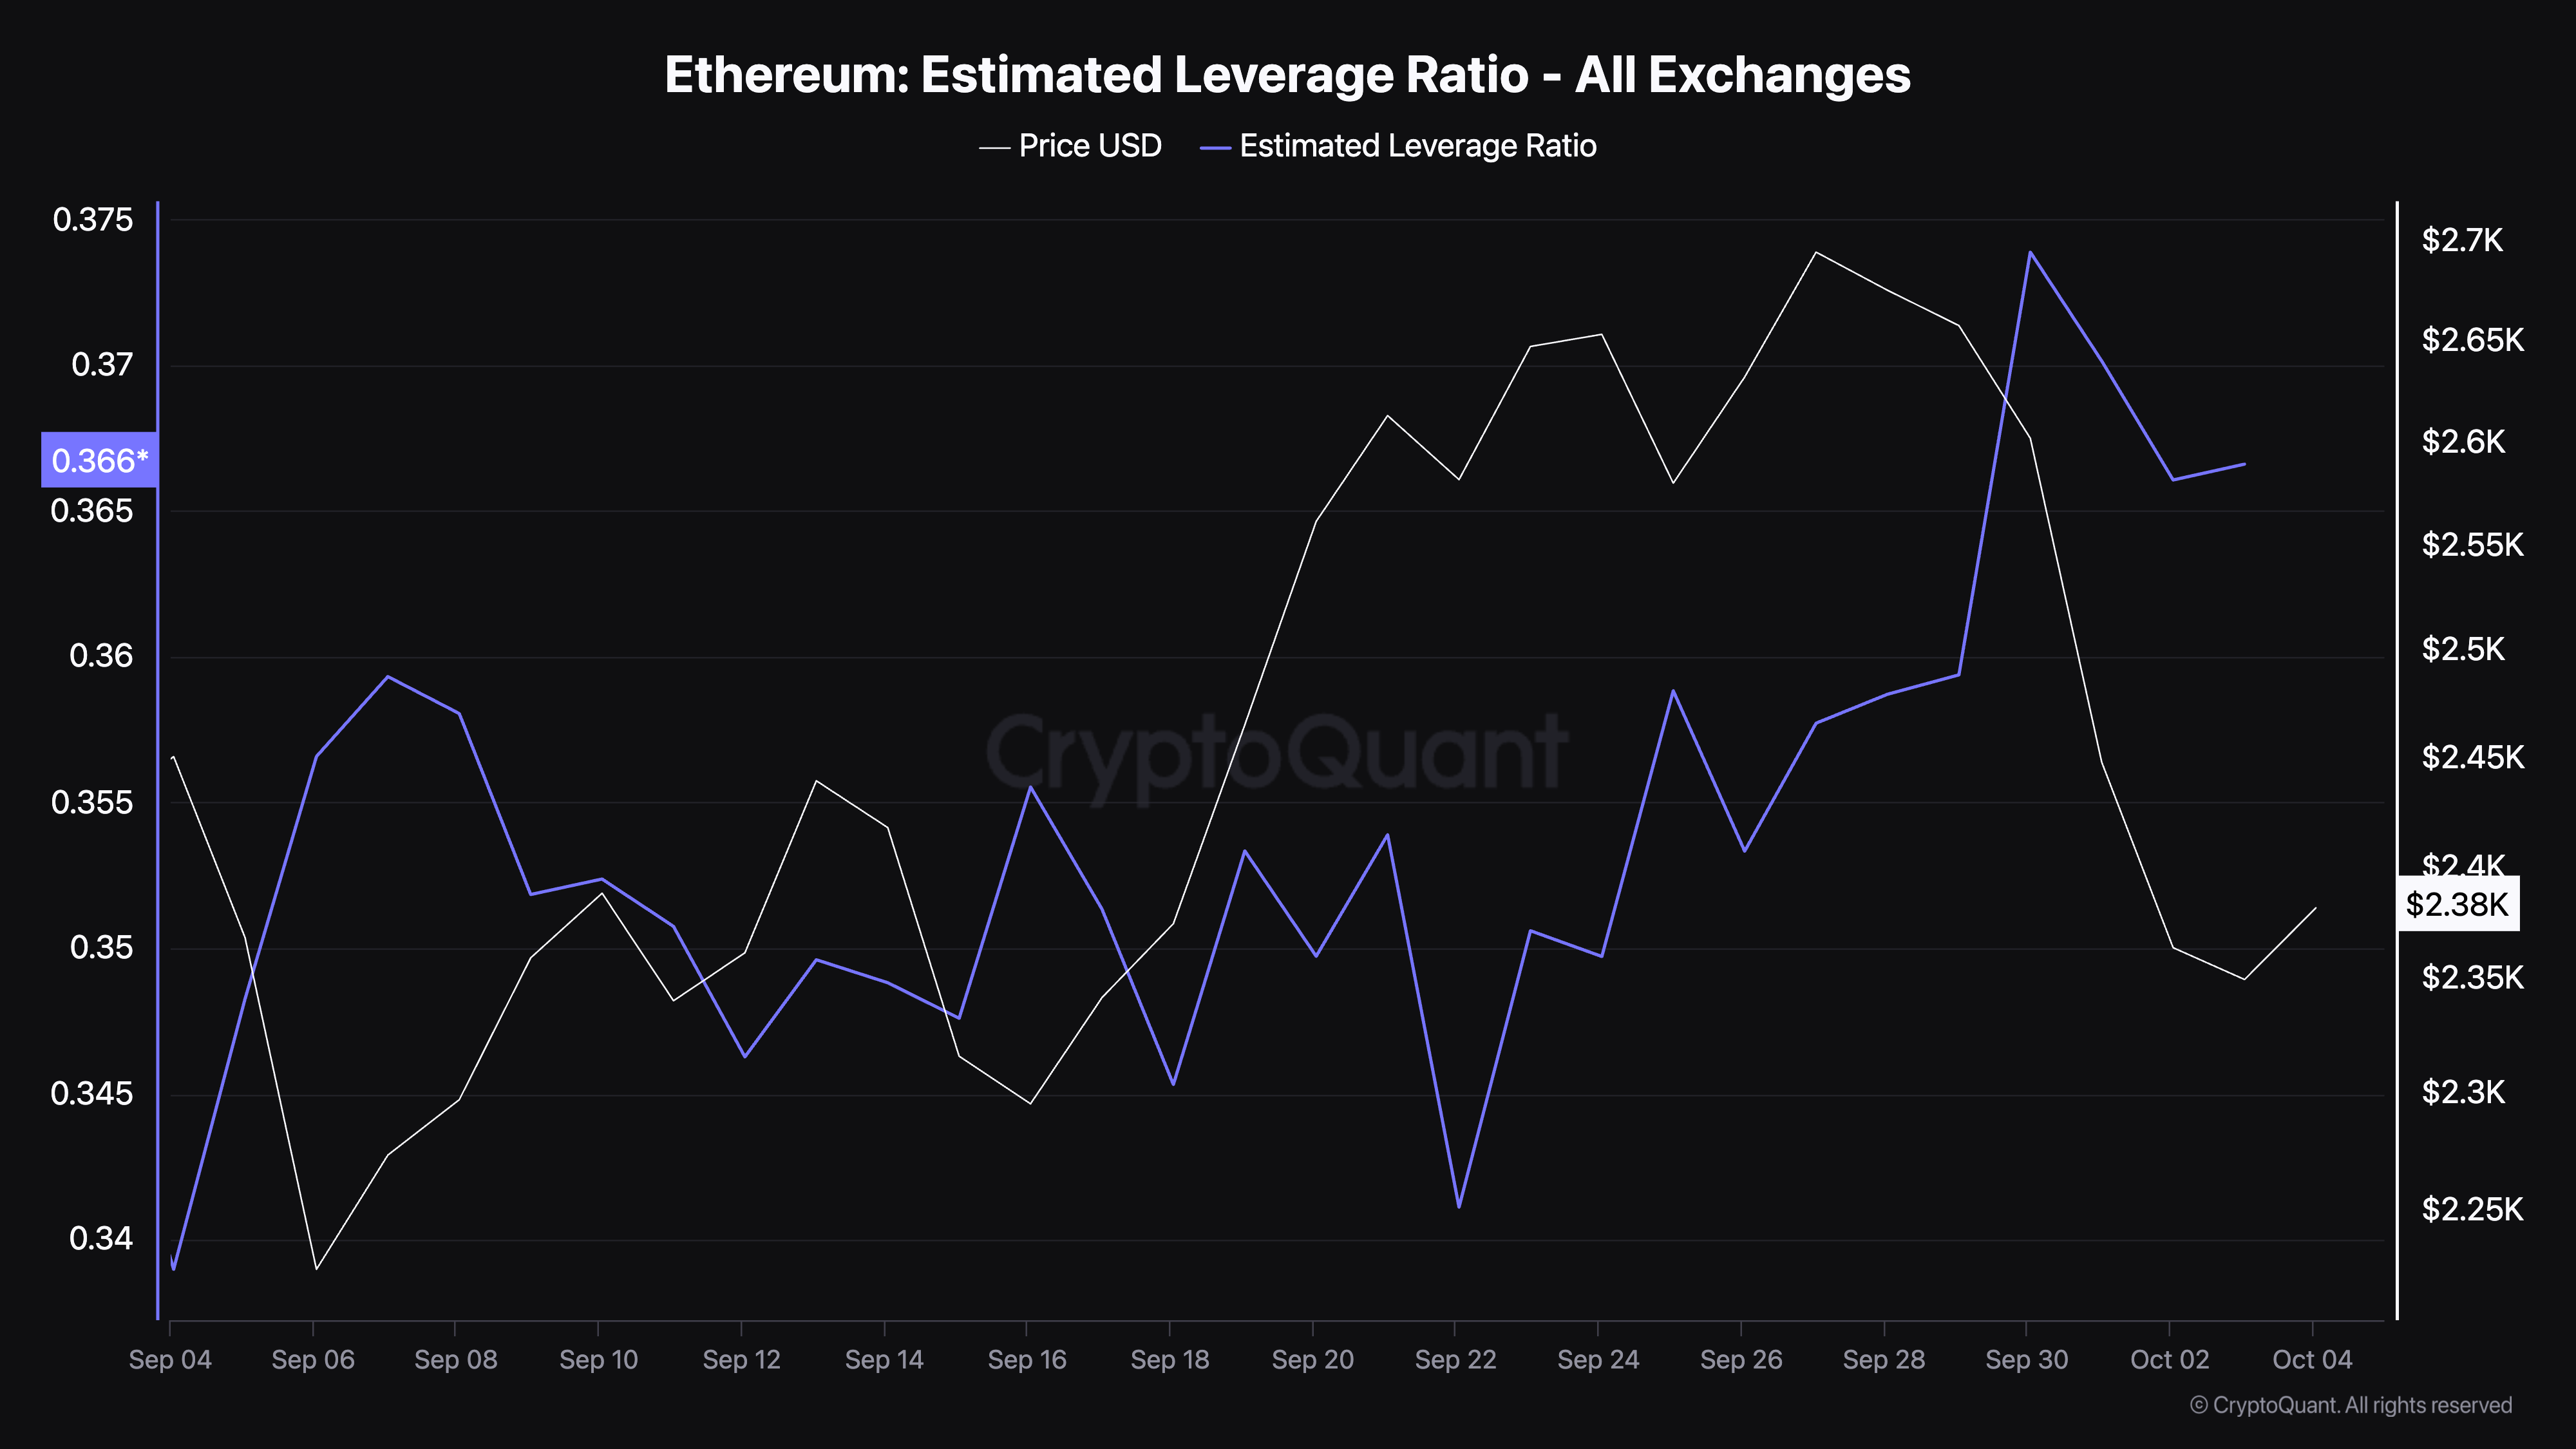
Source: CryptoQuant
A higher leverage ratio can contribute to more dramatic price fluctuations. Leveraged positions are particularly vulnerable to liquidations if the market moves contrary to traders’ expectations.
Moreover, Ethereum’s open interest data from Coinglass indicates an increase of 0.81%, raising the total to $11.44 billion. Open interest represents the total number of outstanding contracts in the derivatives market.
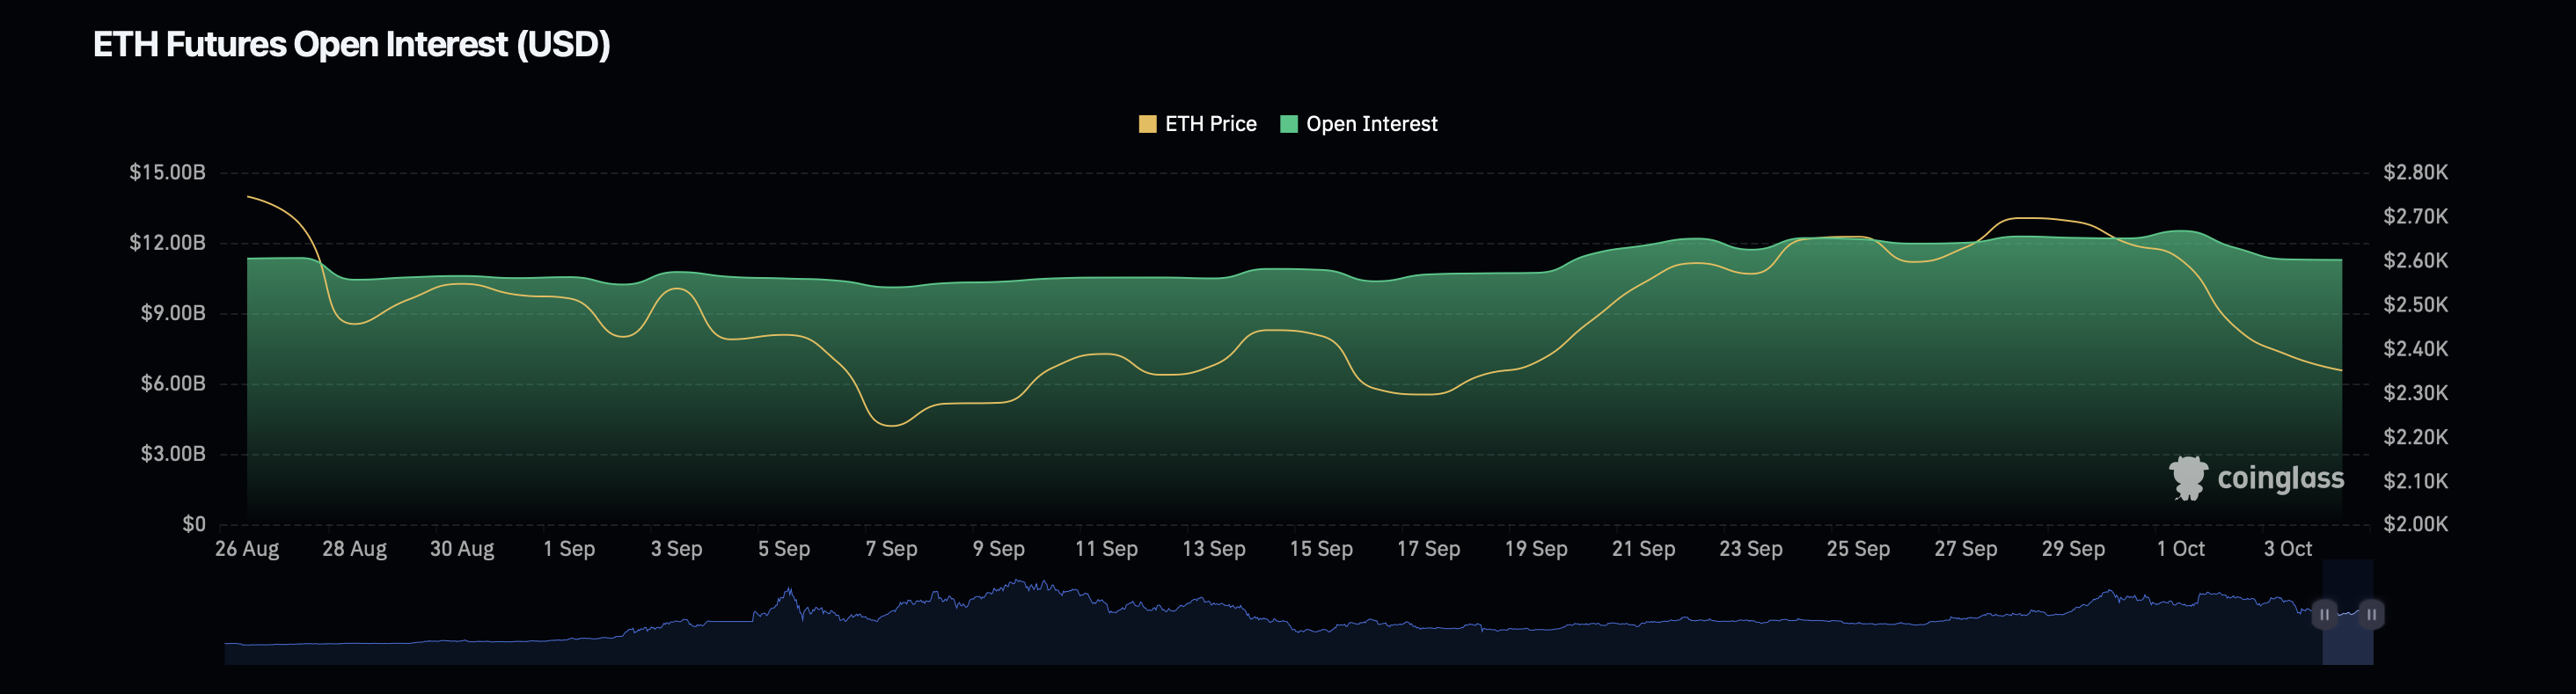
Source: Coinglass
Read Ethereum’s [ETH] Price Prediction 2024–2025
An uptick in this metric can signify increased speculative activity and participation in the market. On the other hand, Ethereum’s open interest volume has decreased by 24.17%, now amounting to $24.33 billion.
This divergence between open interest and volume may indicate a cautious market stance. Traders could be hesitant to take larger positions.


 Dutch
Dutch English
 French
 German
 Greek
Greek Italian
 Portuguese
 Russian
 Spanish