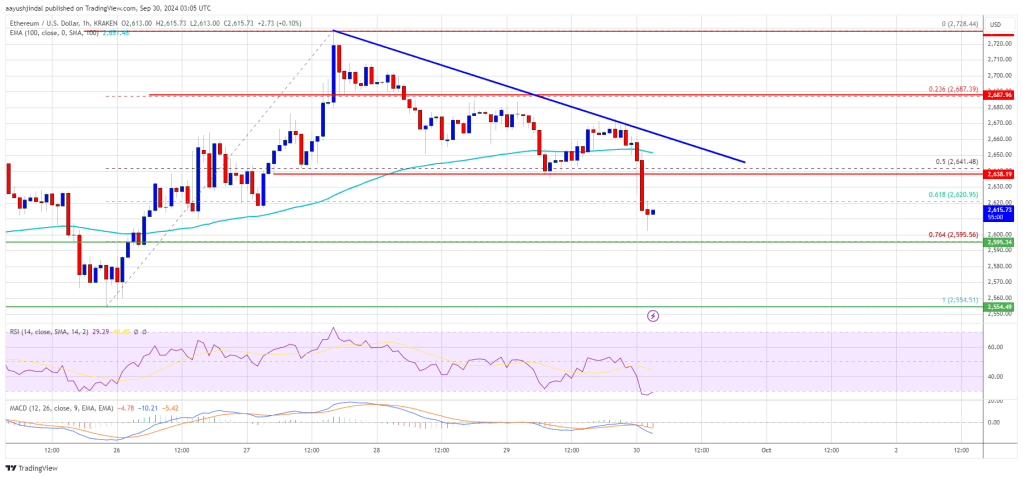
The price of Ethereum is undergoing a correction after hitting the $2,720 resistance. Currently, ETH is trading below $2,650 and may find support around the $2,600 mark.
- Ethereum has initiated a downward correction from the $2,720 area.
- The price is currently below $2,650 and is trading beneath the 100-hourly Simple Moving Average.
- A significant bearish trend line is forming, with resistance at $2,650 on the hourly chart for ETH/USD (data sourced from Kraken).
- The pair needs to remain above the $2,600 support level to potentially initiate a new upward trend in the short term.
Ethereum Price Declines Once More
The price of Ethereum had extended its gains, trading above the $2,650 threshold, and even surpassed the $2,700 level before bearish forces emerged. A peak was established at $2,728 before the price began to correct downwards, similar to Bitcoin.
The price dropped below the $2,700 and $2,650 marks, falling under the 50% Fibonacci retracement level of the rally from the $2,554 swing low to the $2,728 high. Currently, Ethereum is trading beneath $2,650 and below the 100-hourly Simple Moving Average.
Nonetheless, the price may receive support near the $2,600 level, which also aligns with the 76.4% Fibonacci retracement level of the increase from the $2,554 swing low to the $2,728 peak.
On the upside, the price encounters resistance around the $2,650 level. Additionally, a bearish trend line is forming with resistance at this level on the hourly chart of ETH/USD. The first significant resistance is located near the $2,685 mark, followed by another key resistance at approximately $2,720.

An upward break above the $2,720 resistance could lead to further gains in the upcoming sessions. In this scenario, Ether might surge toward the $2,840 resistance area soon. The next resistance hurdle is around $2,880 or $2,920.
Further Declines in ETH?
If Ethereum is unable to break through the $2,650 resistance, it may continue to decline. The initial support on the downside is around the $2,600 level, with the first major support located near the $2,550 zone.
A decisive drop below the $2,550 support may push the price down towards $2,520. Additional losses could bring the price closer to the $2,450 support level in the near future. The subsequent key support level is at $2,365.
Technical Indicators
Hourly MACD – The MACD for ETH/USD is gaining bearish momentum.
Hourly RSI – The RSI for ETH/USD is currently below the 50 threshold.
Major Support Level – $2,600
Major Resistance Level – $2,650


