


Dogecoin is currently trading above the $0.1350 resistance area against the US Dollar. DOGE is displaying encouraging signs and may potentially break through the $0.1450 resistance.
- DOGE’s price has initiated a fresh surge above the $0.1320 resistance threshold.
- The price is currently above the $0.1350 mark and the 100-hourly simple moving average.
- A significant bullish trend line is establishing with support at $0.1420 on the hourly chart for the DOGE/USD pair (data source from Kraken).
- The price could gain bullish momentum if it surpasses the $0.1450 and $0.1465 resistance points.
Dogecoin Price Aims for Further Gains
Dogecoin’s price embarked on a new increase above the $0.1200 resistance area. DOGE made notable progress, crossing over the $0.1320 resistance zone, outpacing Bitcoin and Ethereum. It also achieved movements beyond the $0.1350 and $0.1400 resistance levels.
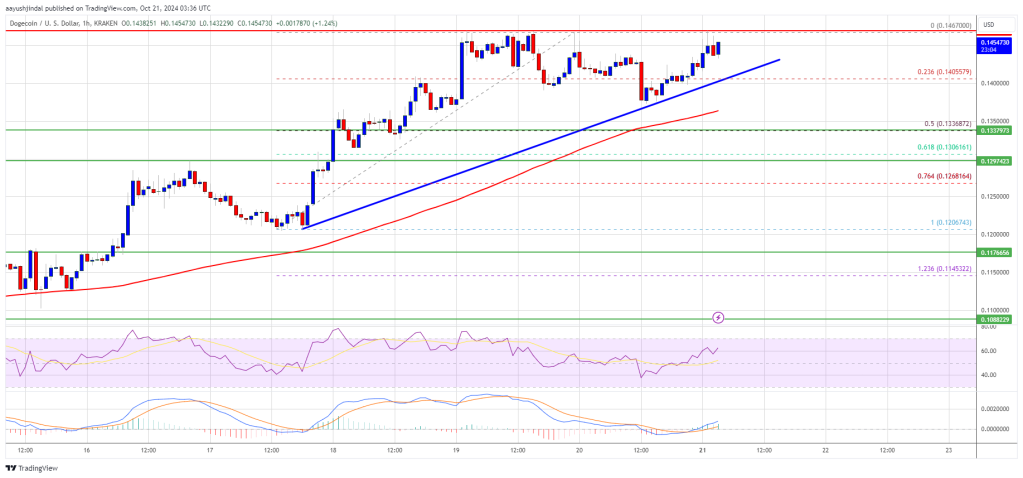
The price reached a maximum of $0.1467 before witnessing a slight corrective downturn. The price fell below the $0.1420 mark and dipped marginally below the 23.6% Fib retracement level from the upward move between the $0.1206 swing low and the $0.1467 peak.
Nonetheless, buyers remain active above the $0.1350 level. A key bullish trend line is forming with support at $0.1420 on the hourly DOGE/USD chart. Currently, Dogecoin is trading above the $0.1320 level and the 100-hourly simple moving average. Immediate resistance lies near the $0.1465 mark, while the next significant resistance level is around $0.1480.
A close above the $0.1480 resistance could propel the price towards the $0.1520 resistance level. Further gains might push the price closer to the $0.1550 mark, with the bulls eyeing the next major target at approximately $0.1585.
Are Dips Supported in DOGE?
If DOGE’s price struggles to climb past the $0.1465 level, it may trigger another decline. The initial support on the downside is situated near the $0.1420 level, while the next substantial support is around the $0.1400 area.
The key support level is located at $0.1335 or the 50% Fib retracement level from the upward move between the $0.1206 swing low and the $0.1467 high. If the price slips below the $0.1335 support, it could further decline. In this scenario, the price may trend down to the $0.1250 level or even $0.1220 shortly after.
Technical Indicators
Hourly MACD – The MACD for DOGE/USD is presently gaining traction in the bullish territory.
Hourly RSI (Relative Strength Index) – The RSI for DOGE/USD is currently above the 50 mark.
Major Support Levels – $0.1465 and $0.1500.
Major Resistance Levels – $0.1420 and $0.1335.


 Dutch
Dutch English
 French
 German
 Greek
Greek Italian
 Portuguese
 Russian
 Spanish