


- Chainlink’s Open Interest reached a three-month peak of $206M
- A descending triangle pattern on the daily chart indicated an ongoing bearish trend
As of this writing, Chainlink (LINK) was displaying signs of a weakening upward movement. LINK was priced at $11.38, down 0.6%, despite a 4% increase over the past week. Spot trading volumes also dipped approximately 9% — indicating a decrease in interest for the altcoin.
In contrast, an analysis of the Futures market showed that more traders are opening positions on LINK. Open Interest (OI) climbed to a 13-week high of $206M — indicating increased activity amongst derivative traders speculating on future price trends.
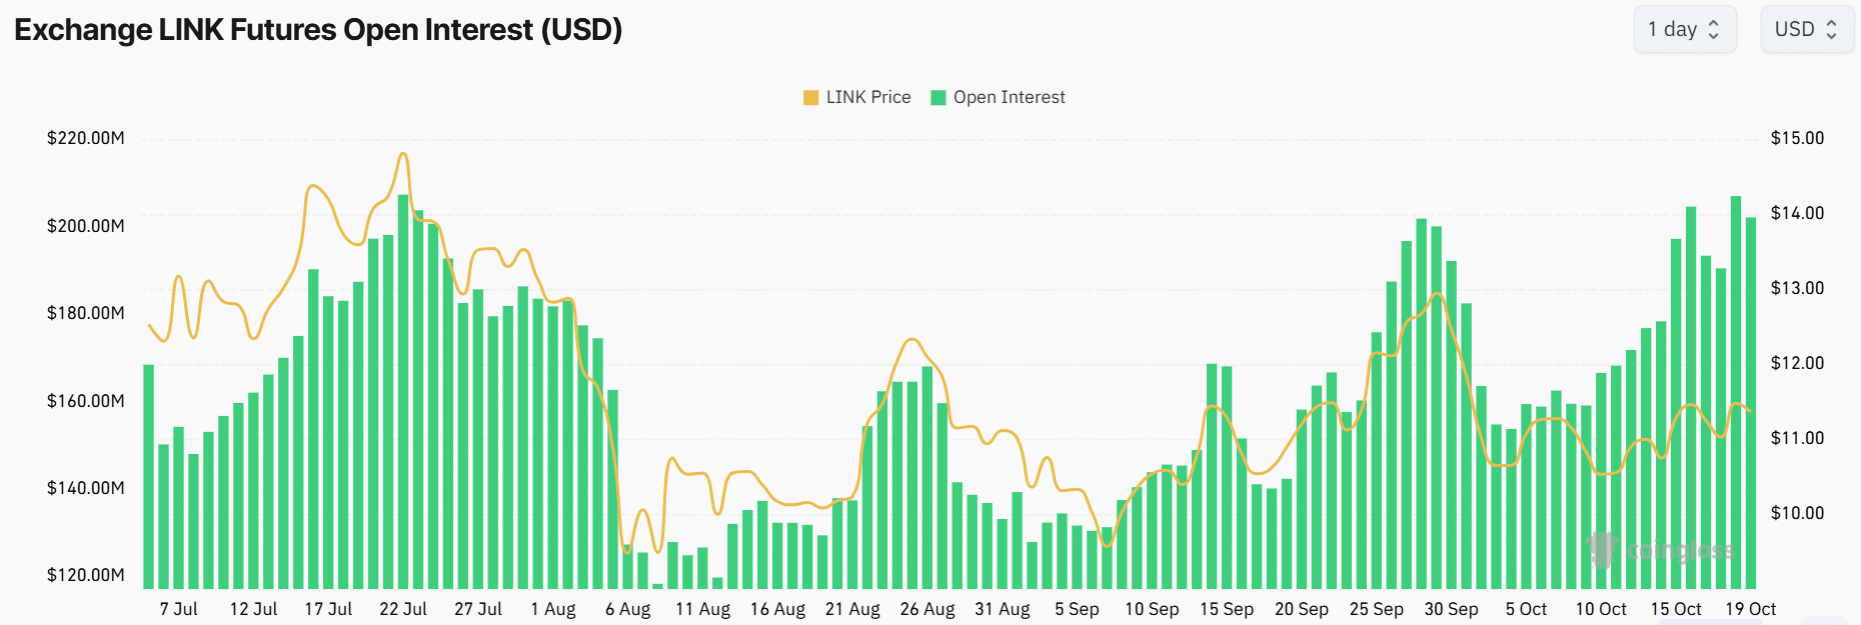
Source: Coinglass
It’s important to note that spikes in OI have previously preceded declines in LINK’s values. For example, on July 22, when LINK’s OI reached this level, the altcoin’s price plummeted by 45% within a mere two weeks.
In late September, LINK’s OI surged to a two-month high once more before experiencing a nearly 20% price drop.
Thus, should Chainlink adhere to its historical patterns, a bearish sentiment could emerge shortly.
Chainlink shows bullish indicators
The daily chart depicted that LINK’s Relative Strength Index was at 52 — a nearly neutral zone suggesting a slight buyer dominance over sellers. The RSI line was above the Signal line, indicating potential bullish momentum.
However, at the time of writing, this line appeared to be trending downwards — a signal that sellers are entering the market.
This muted bullish sentiment is further corroborated by the Awesome Oscillator’s (AO) bars. Although the bars register as green, they remain negative — signaling insufficient buying pressure to sustain an uptrend.
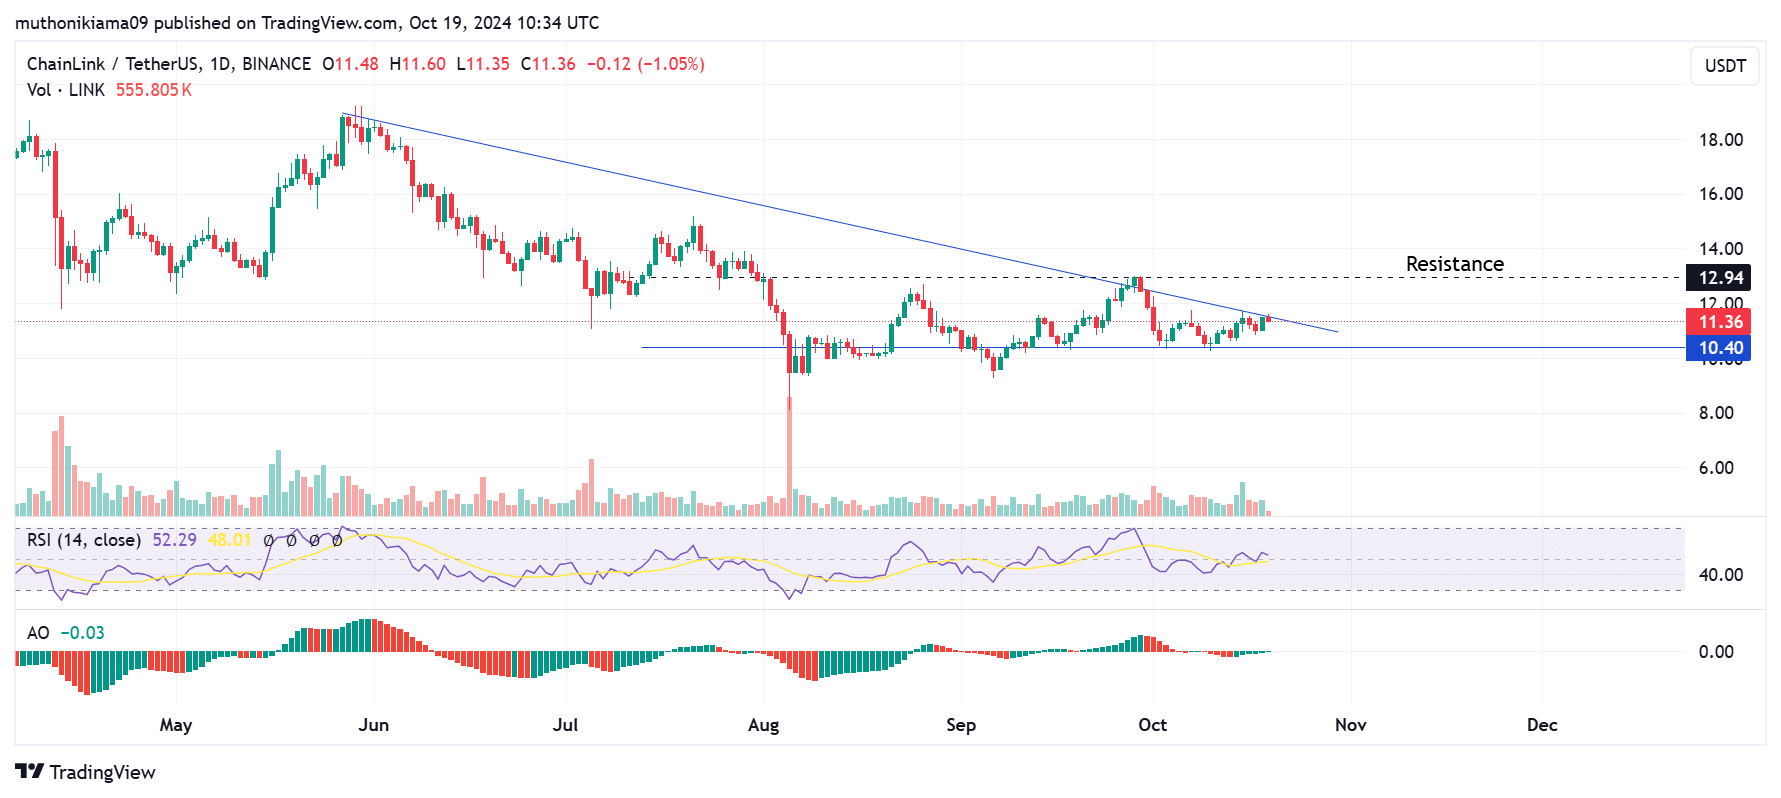
Source: Tradingview
LINK has also formed a descending triangle pattern, which typically signifies a bearish continuation. The altcoin was trading at the upper boundary of this channel, indicating that bulls are trying to take control.
However, a breakout is usually accompanied by increased buying volumes. The volume histogram bars demonstrated that buyers have been sparse, alongside periods of selling activity.
If buyers return to the market and LINK manages to bypass this bearish outlook, the next resistance level will be at $12.94. Conversely, if the bearish trend continues, LINK could potentially test the support level at $10.40.
A key driver needed to bolster LINK’s upward trajectory is the activity of whales. Large transaction volumes surged earlier in the week to $100M; however, by the time of writing, they had decreased to $36M — indicating a lull in whale engagement. This inactivity could lead to diminished price action.
(Source: IntoTheBlock)


 Dutch
Dutch English
 French
 German
 Greek
Greek Italian
 Portuguese
 Russian
 Spanish