


Cardano’s price has commenced a notable increase above the $0.3620 resistance. ADA is currently exhibiting positive indicators and has the potential to climb further towards $0.420.
- ADA price initiated a recovery wave from the $0.3420 level.
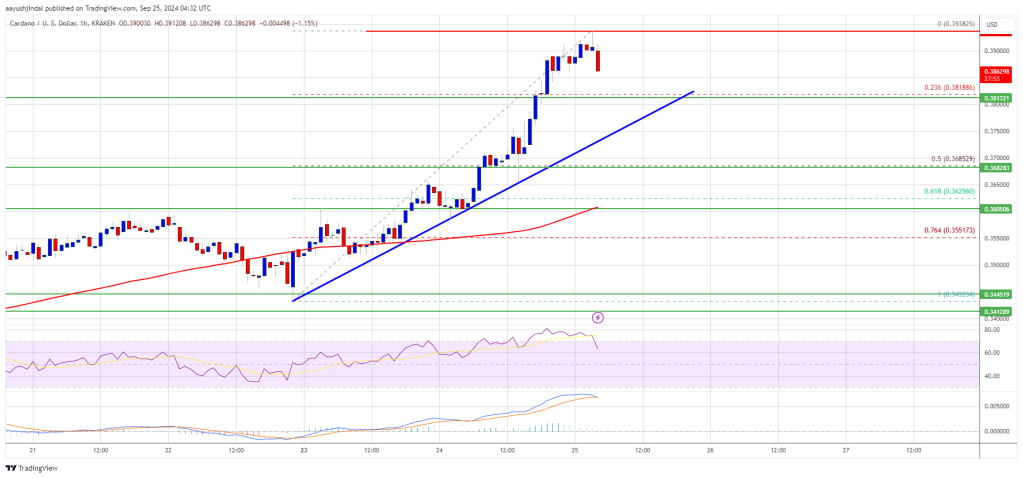
- The price is trading above $0.380 and the 100-hour simple moving average.
- A significant bullish trend line is forming with support at $0.3810 on the hourly chart for the ADA/USD pair (data sourced from Kraken).
- The pair may continue to ascend if it maintains stability above the $0.3800 support area.
Cardano Price Begins Steady Climb
After establishing a base above the $0.3420 level, Cardano has embarked on a substantial increase. A notable movement occurred above the $0.3550 and $0.3650 resistance levels, similar to Bitcoin and Ethereum.
The bulls have pushed the price above the $0.380 resistance, creating a high at $0.3938, and the price is now solidifying gains. It remains above the 23.6% Fibonacci retracement level of the upward movement from the $0.3432 swing low to the $0.3938 high.
Cardano’s price is currently trading above $0.380 and the 100-hour simple moving average. Additionally, there is a significant bullish trend line forming with support at $0.3810 on the hourly chart for the ADA/USD pair.
On the upside, the price may encounter resistance near the $0.3900 zone. The initial resistance is around $0.3940, while the next key resistance could be $0.4200. A closing above the $0.4200 resistance may trigger a significant rally. In such a scenario, the price could ascend towards the $0.450 range, with further gains possibly driving it towards $0.500.
Will Dips Find Support in ADA?
If Cardano’s price fails to surpass the $0.3900 resistance level, it may initiate another decline. Immediate support on the downside is near the $0.380 level and the trend line.
The next major support is near the $0.3650 level, coinciding with the 50% Fib retracement level of the move from $0.3432 swing low to $0.3938 high. A break below the $0.3650 level could lead to a test of $0.3550. Further support lies at the $0.3420 level, where buying interest might re-emerge.
Technical Indicators
Hourly MACD – The MACD for ADA/USD is gaining traction in the bullish zone.
Hourly RSI (Relative Strength Index) – The RSI for ADA/USD is currently positioned above the 50 threshold.
Major Support Levels – $0.3800 and $0.3650.
Major Resistance Levels – $0.3900 and $0.4200.


 Dutch
Dutch English
 French
 German
 Greek
Greek Italian
 Portuguese
 Russian
 Spanish