


Cardano’s price has begun a new decline after facing resistance at $0.3850. ADA is holding steady above the $0.3350 mark and may attempt a recovery soon.
- The ADA price has initiated a downward trend, dipping below the $0.3550 support zone.
- The current trading price is below $0.350 and the 100-hourly simple moving average.
- A short-term bearish trend line is taking shape, with resistance at $0.3480 on the hourly chart of the ADA/USD pair (data sourced from Kraken).
- The pair may continue to slide if it remains beneath the $0.360 resistance area.
Cardano Price Experiences Another Drop
After reaching the $0.4150 resistance level, Cardano struggled to maintain upward momentum. ADA created a short-term peak and commenced a new decline similar to Bitcoin and Ethereum. It fell below the $0.3850 and $0.3650 support levels.
The price dropped further below $0.350; however, bulls stepped in. A low of $0.3360 was established, and the price is currently consolidating its losses. A slight increase occurred above the $0.3420 level. The price has tested the 23.6% Fibonacci retracement level from the downward move starting at the $0.3853 swing high down to the $0.3360 low.
Currently, Cardano’s price is trading under the $0.360 threshold and below the 100-hourly simple moving average. If the price trends upward, it may encounter resistance around the $0.3500 zone. Additionally, the emerging short-term bearish trend line has a resistance mark set at $0.3480 on the hourly chart for the ADA/USD pair.
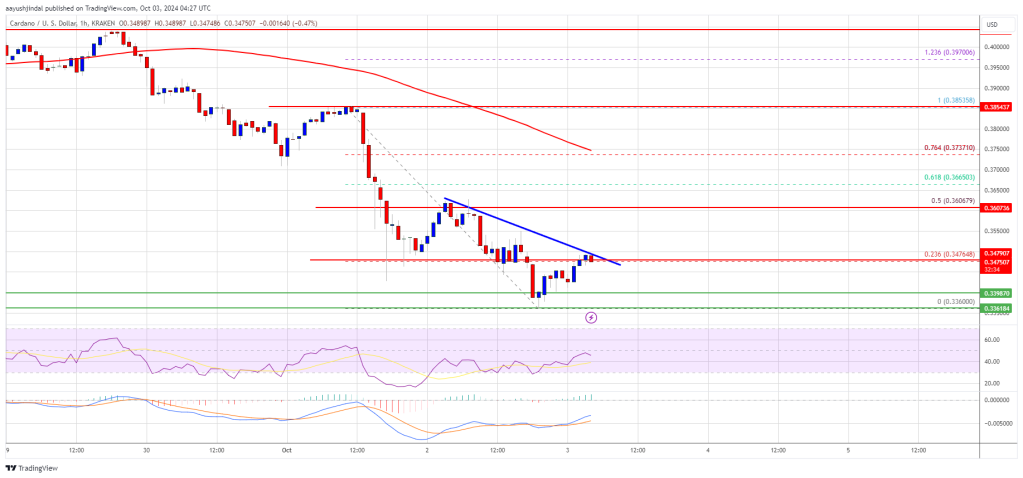
The initial resistance level is located near $0.360, aligning with the 50% Fibonacci retracement points from the downward trajectory that began at the $0.3853 swing high and dipped to the $0.3360 low. The following significant resistance may be at $0.3740. A close above this $0.3740 resistance could spark a strong upward movement. Should this occur, the price may advance toward the $0.400 region, with potential for further gains that could lead to $0.4150.
Will ADA Face Additional Declines?
If Cardano’s price is unable to surpass the $0.3500 resistance level, it might initiate another downward trend. The immediate support on the downside resides around the $0.340 level.
The next crucial support level lies near $0.3350. Breaching below $0.3350 could pave the way for a test of $0.3220. Further downside could see the next major support near the $0.300 level, where bulls may potentially re-enter the market.
Technical Indicators
Hourly MACD – The MACD for ADA/USD is gathering momentum in the bearish territory.
Hourly RSI (Relative Strength Index) – The RSI for ADA/USD is now below the 50 mark.
Major Support Levels – $0.3400 and $0.3350.
Major Resistance Levels – $0.3500 and $0.3600.


 Dutch
Dutch English
 French
 German
 Greek
Greek Italian
 Portuguese
 Russian
 Spanish