


The price of Cardano has begun a new decline beneath the $0.3550 mark. ADA is currently stabilizing above the $0.3400 level and may attempt to initiate a recovery movement.
- The price of ADA has embarked on a downward trajectory below the $0.3500 support threshold.
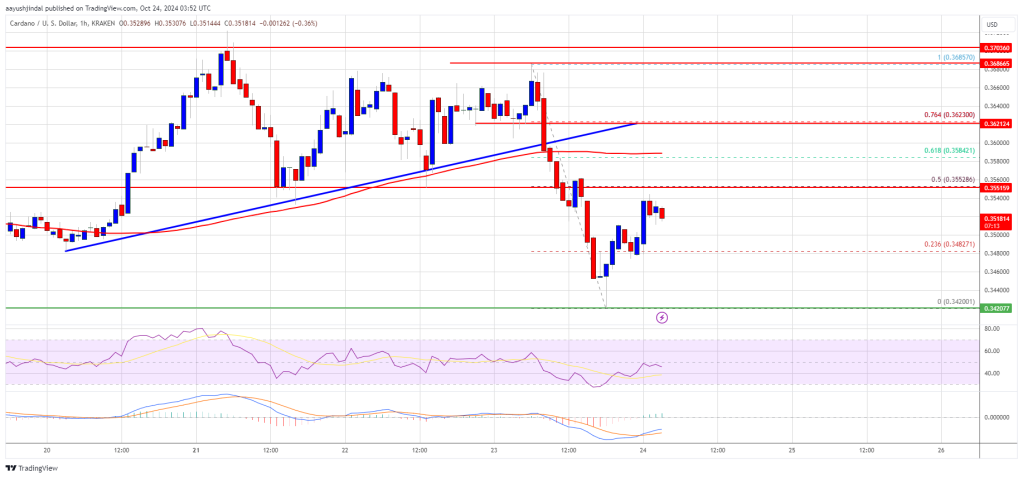
- The current trading price is under $0.3550 and the 100-hourly simple moving average.
- A significant bearish trend line with support at $0.3600 was breached on the hourly chart for the ADA/USD pair (data sourced from Kraken).
- If it manages to overcome the $0.3585 resistance level, the pair may attempt a recovery wave.
Cardano Price Retains Its Losses
After hitting the $0.3685 resistance, Cardano encountered difficulties in continuing its upward trajectory. ADA established a temporary peak and began a new decline, similar to the movements seen in Bitcoin and Ethereum. This resulted in a drop below the $0.3550 and $0.3500 support levels.
A key bullish trend line with support at $0.3600 was penetrated on the hourly chart for the ADA/USD pair. The price also fell below the $0.3440 mark before a support rally emerged. A low reached $0.3420, and now the price is correcting some losses, experiencing a slight uptick above the $0.3480 level.
The price has cleared the 23.6% Fibonacci retracement level of the downward movement from the $0.3685 swing high to the $0.3420 low. Currently, Cardano’s price is trading under $0.3550 and the 100-hourly simple moving average.
On the upside, the price may encounter resistance around the $0.3550 range or near the 50% Fibonacci retracement level from the downward move between the $0.3685 swing high and the $0.3420 low. The initial resistance point is around $0.3585, with the subsequent key resistance potentially being $0.3685.
If the price manages to close above the $0.3685 resistance, a robust rally could commence. In such a scenario, the price could ascend towards the $0.3780 region. Further advancements might push the price towards $0.3950.
Is Another Decline Ahead for ADA?
If Cardano fails to rise above the $0.3550 resistance point, another decline may be imminent. Immediate downside support is located near the $0.3480 level.
The next significant support level is around $0.3420. A breach below this level could pave the way for a test of $0.3250, with subsequent major support around the $0.3120 level where bullish activity might occur.
Technical Indicators
Hourly MACD – The MACD for ADA/USD is showing a loss of momentum within the bearish area.
Hourly RSI (Relative Strength Index) – The RSI for ADA/USD is currently situated below the 50 mark.
Major Support Levels – $0.3450 and $0.3420.
Major Resistance Levels – $0.3550 and $0.3685.


 Dutch
Dutch English
 French
 German
 Greek
Greek Italian
 Portuguese
 Russian
 Spanish