

The price of Ripple’s (XRP) decreased from $0.63 to $0.52 earlier this week, triggered by ongoing regulatory disputes with the US SEC. However, participants in the derivatives market appear to view this decline as a short-lived hurdle instead of a long-term challenge, as they maintain positions anticipating a recovery for the altcoin.
Regardless of its validity, this analysis delves into the underlying reasons for this sentiment and explores what might be next for XRP.
Ripple Bulls Anticipate a Positive Turnaround
On Wednesday, the US SEC initiated an appeal contesting XRP’s designation as a non-security, which had been established by the court in July 2023. Following this announcement, XRP’s price plummeted, erasing a considerable portion of its recent progress.
While traders experienced initial panic and tended to go short on the token, data from Coinglass indicates a shift in sentiment. As reported by the derivatives analytics portal, XRP’s Long/Short Ratio has increased to 2.10.
This ratio reflects whether more traders are favoring long positions over short ones. A reading below 1 suggests a majority are opting for short positions, indicating bearish sentiment. Conversely, a reading above 1 signifies a predominance of long positions.
Read more: XRP ETF Explained: What It Is and How It Works
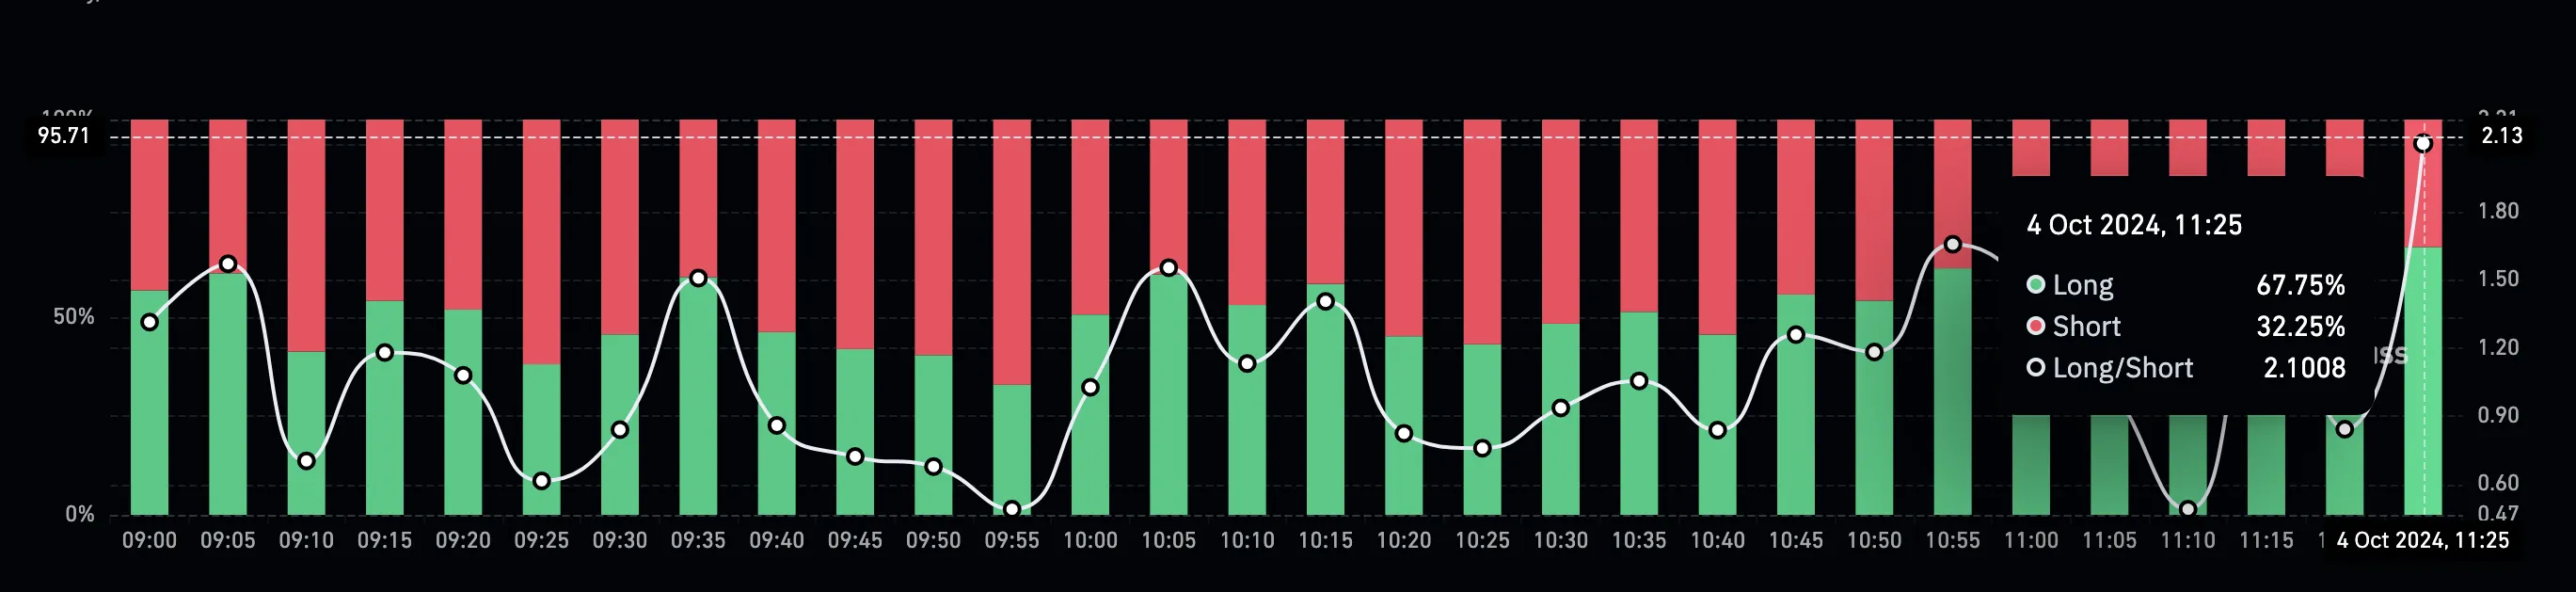
In the case of XRP, 67.75% of traders are holding long positions, while 32.25% are taking short positions. This suggests that the majority of traders are expecting an increase in XRP’s price once the discussions regarding the SEC appeal settle down.
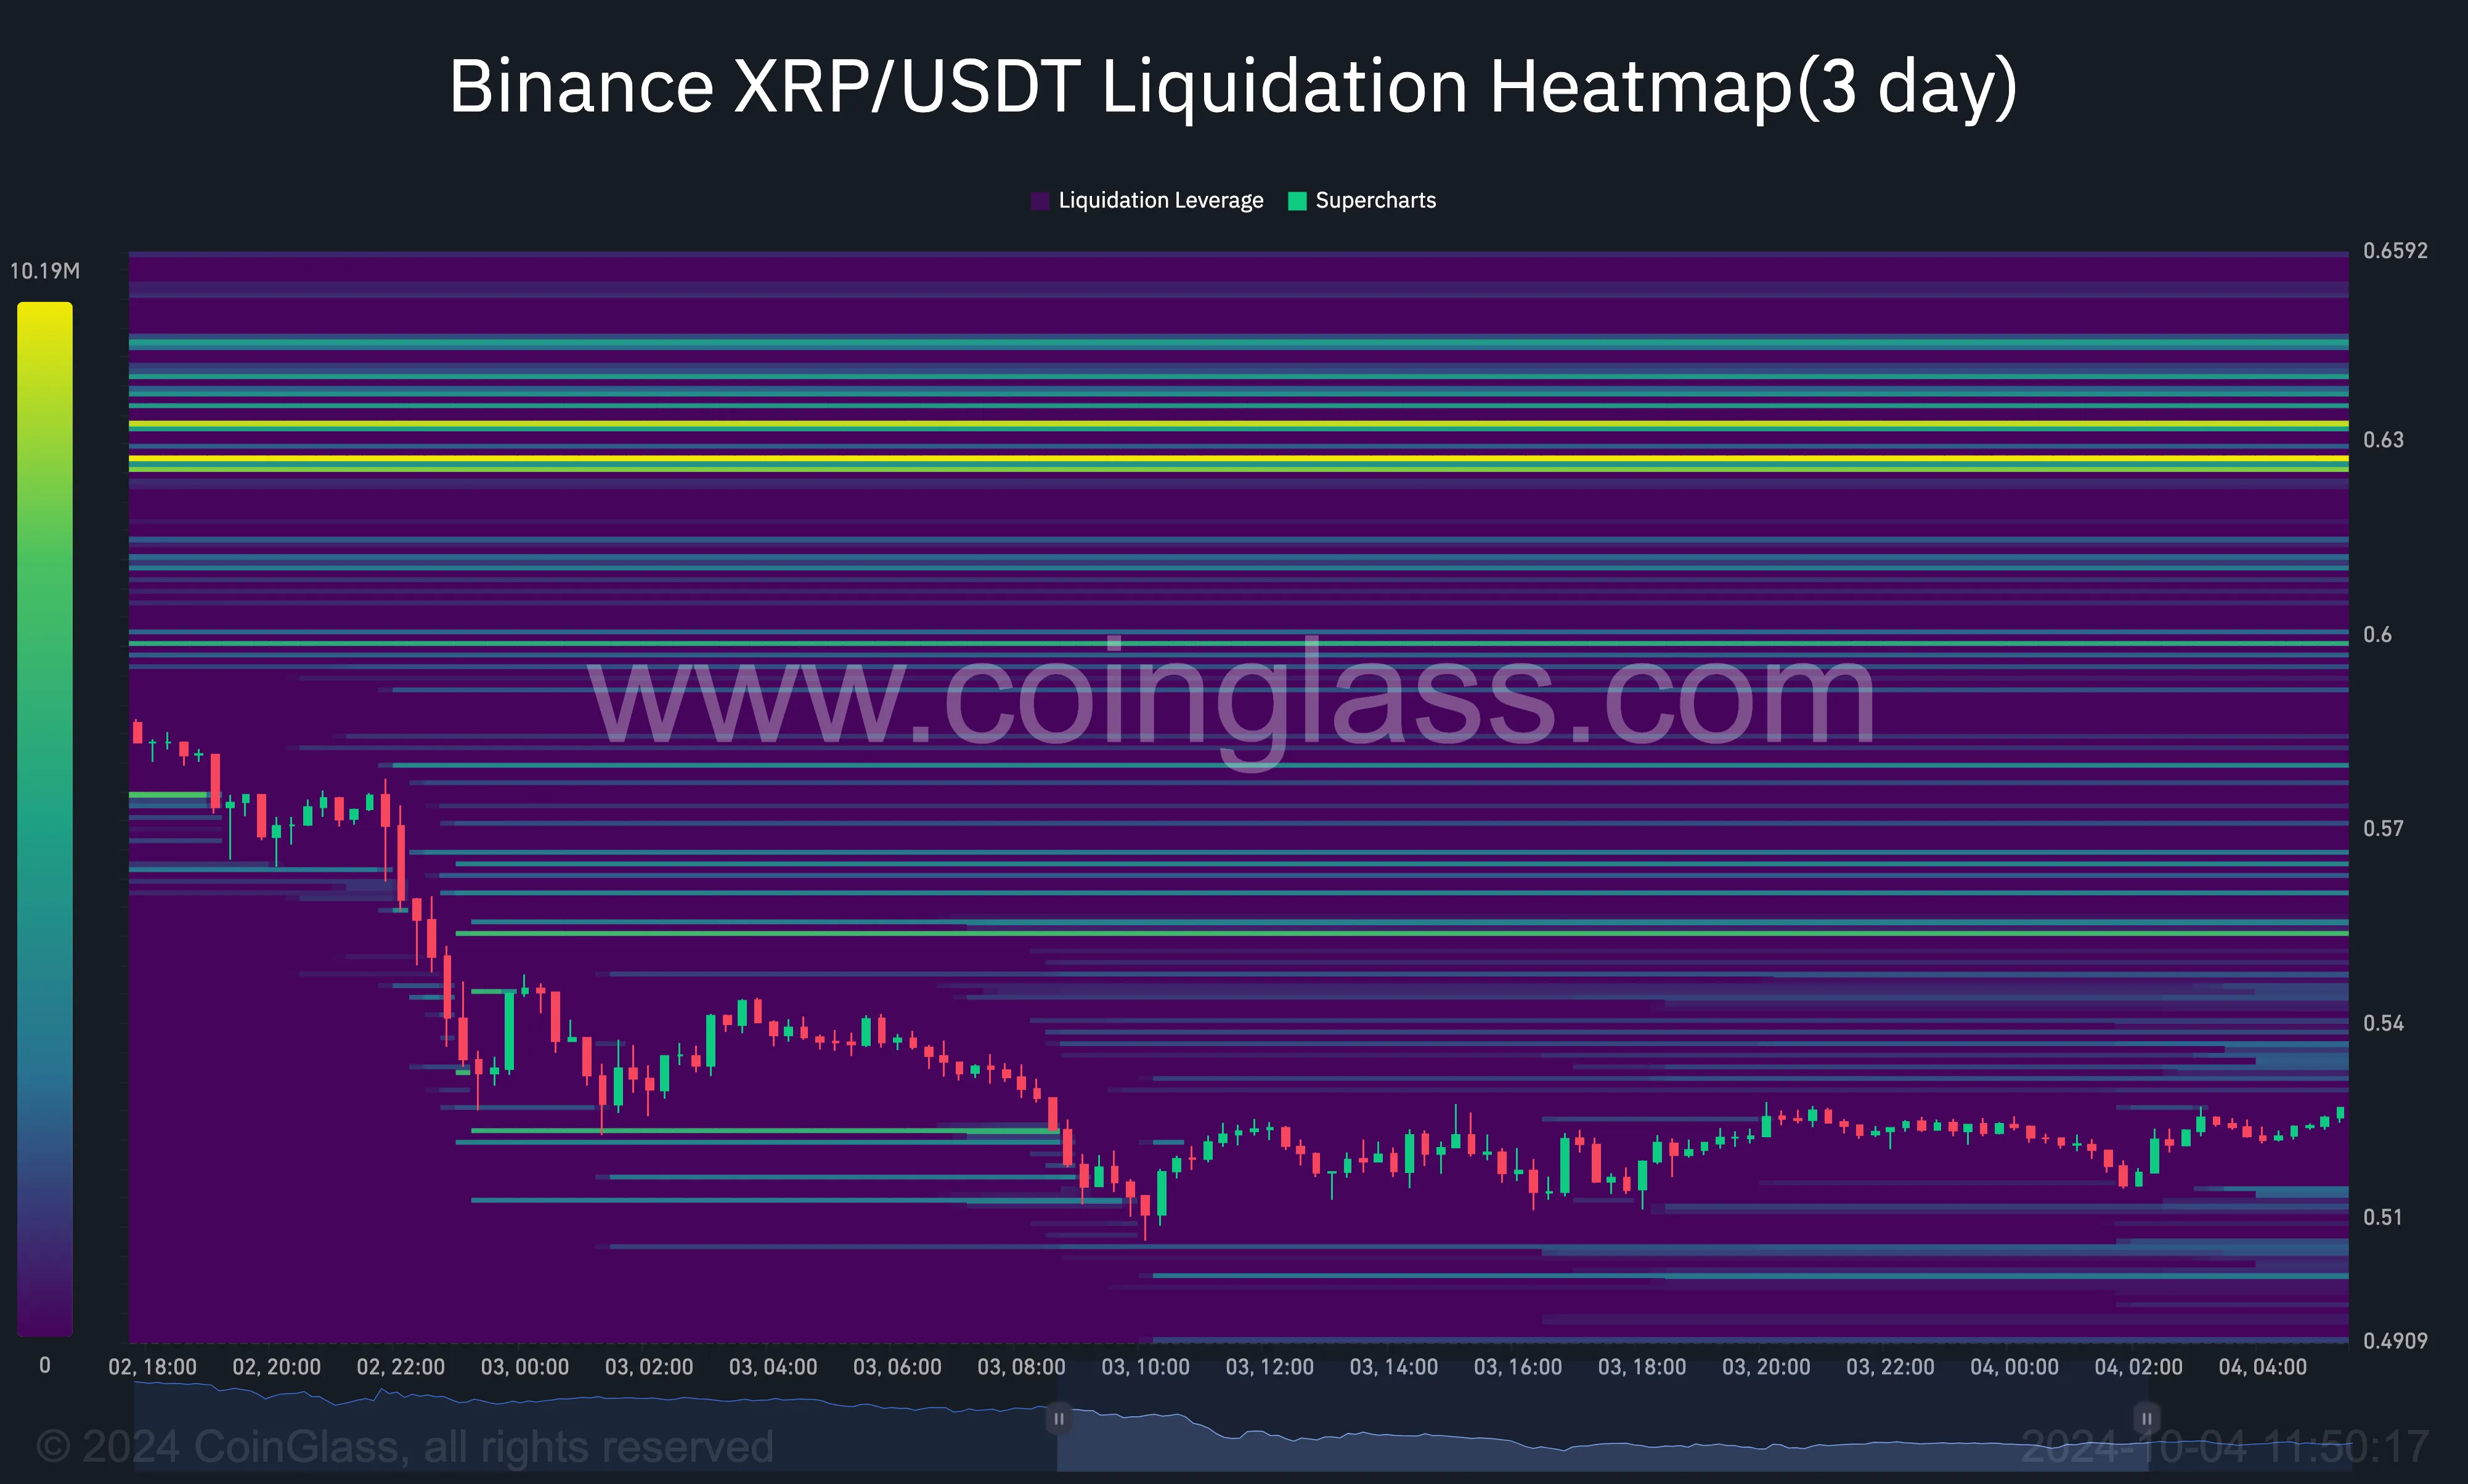
Moreover, the liquidation heatmap, which highlights high liquidity zones, appears to support this bullish outlook. Specifically, if the heatmap transitions from purple to yellow, it indicates a significant concentration of liquidity at that price point, potentially steering price movement in that direction. For XRP, these zones exist between $0.62 and $0.63, hinting that the altcoin may soon experience a rebound towards these levels.
XRP Price Forecast: Oversold and Poised for a Rebound
An examination of the Bollinger Bands (BB) on the daily chart reveals increased volatility for XRP as the bands have broadened. In addition to indicating volatility levels, the BB can also signify whether a token is overbought or oversold.
When the price touches the upper band of the BB, it indicates overbought conditions. Conversely, touching the lower band signals oversold conditions. As illustrated below, the lower band has intersected XRP’s price at $0.52.
This suggests that minor buying activity could potentially trigger a rebound. Additionally, XRP’s current price aligns with the 38.2% Fibonacci retracement level, which is considered a crucial support level that may facilitate a recovery.
Read more: How To Buy XRP and Everything You Need To Know
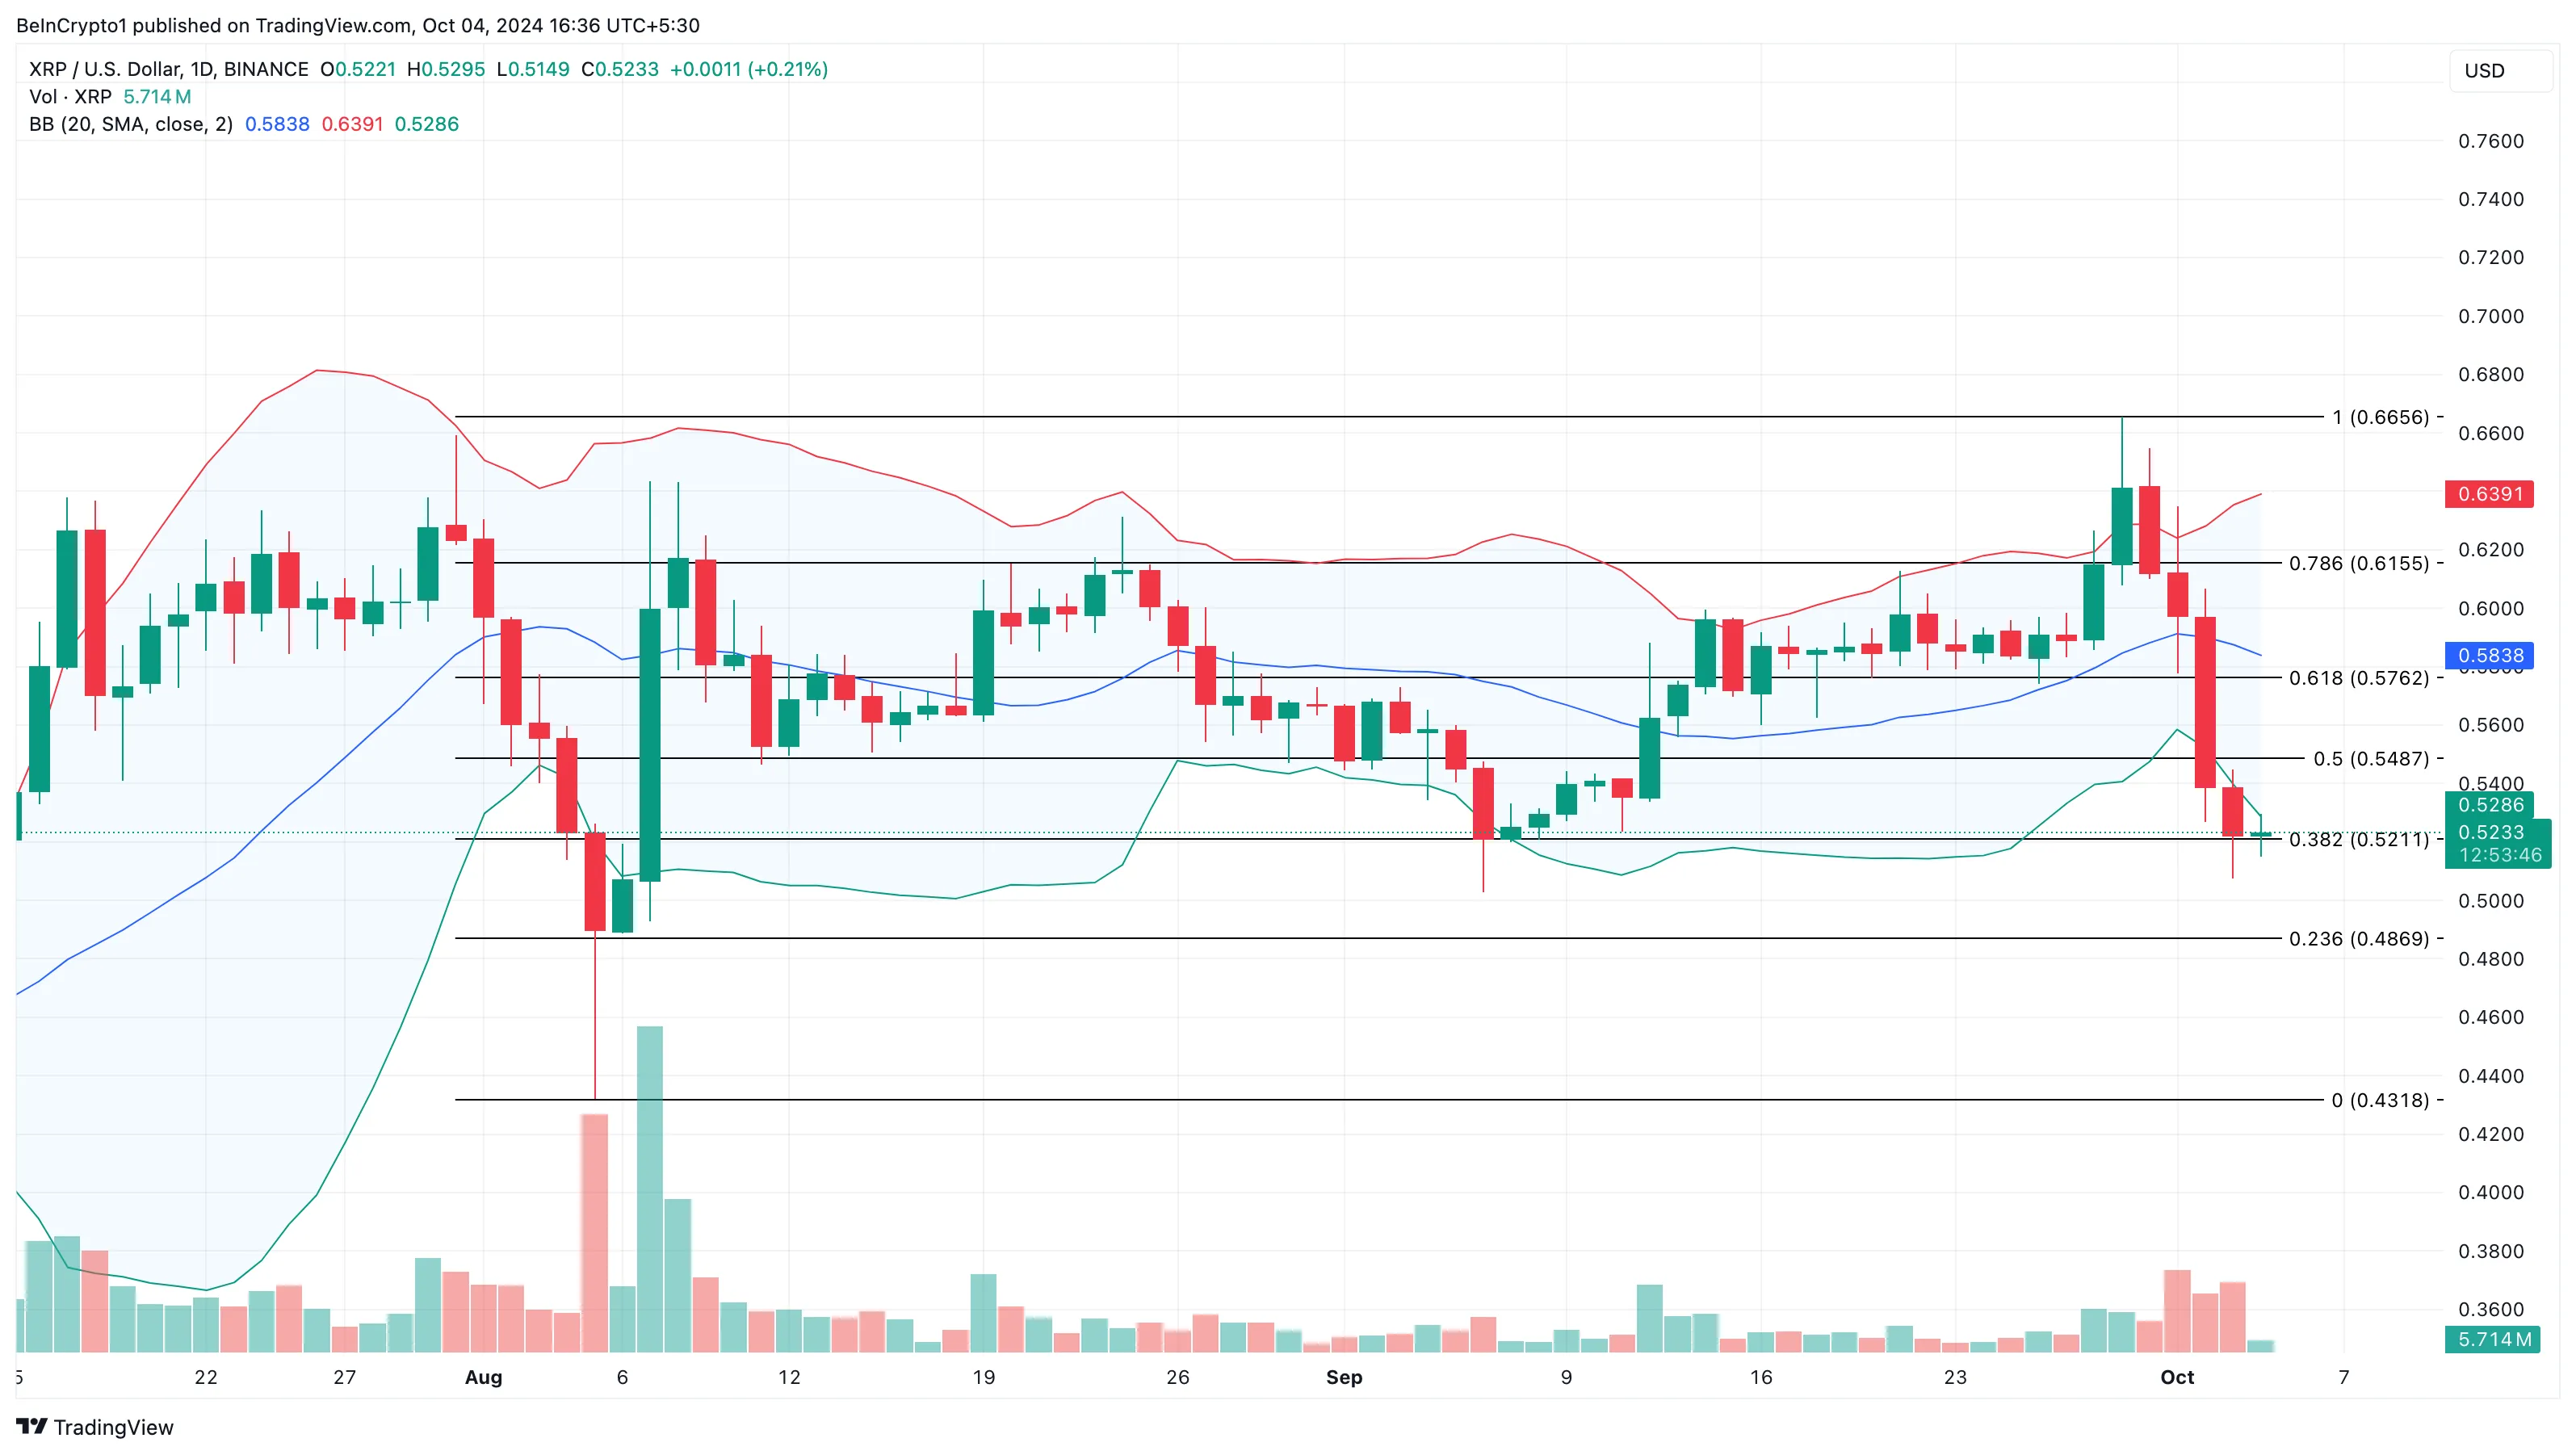
Consequently, there is a strong possibility that XRP’s price will overcome the $0.58 resistance level. If this occurs, the altcoin could surge to $0.62. However, should the SEC appeal progress unfavorably for Ripple, this projection might be rendered invalid, potentially driving XRP’s price down to $0.48.
Disclaimer
As per the Trust Project guidelines, this price analysis article serves informational purposes only and should not be construed as financial or investment advice. BeInCrypto is dedicated to providing accurate, unbiased reporting, though market conditions may change without notice. Always perform your own research and consult a professional prior to making any financial decisions. Please be aware that our Terms and Conditions, Privacy Policy, and Disclaimers have been updated.


 Dutch
Dutch English
 French
 German
 Greek
Greek Italian
 Portuguese
 Russian
 Spanish