


- The MACD indicator for Ethereum on the daily chart has demonstrated a bullish divergence.
- There has been a notable increase in Ethereum exchange outflows and open interest, suggesting a bullish outlook.
The crypto fear and greed index surged to 73 following Bitcoin’s [BTC] rise above $67,000. Despite this optimistic sentiment, Ethereum [ETH] has yet to experience significant upward movement.
At the time of writing, the largest altcoin was trading at $2,604, reflecting a minor 0.4% decline over the last 24 hours.
Ethereum is exhibiting a bullish divergence on its daily chart with the Moving Average Convergence Divergence currently positive.
Moreover, the MACD histogram has turned green and is expanding, indicating that bullish sentiment is gaining momentum.
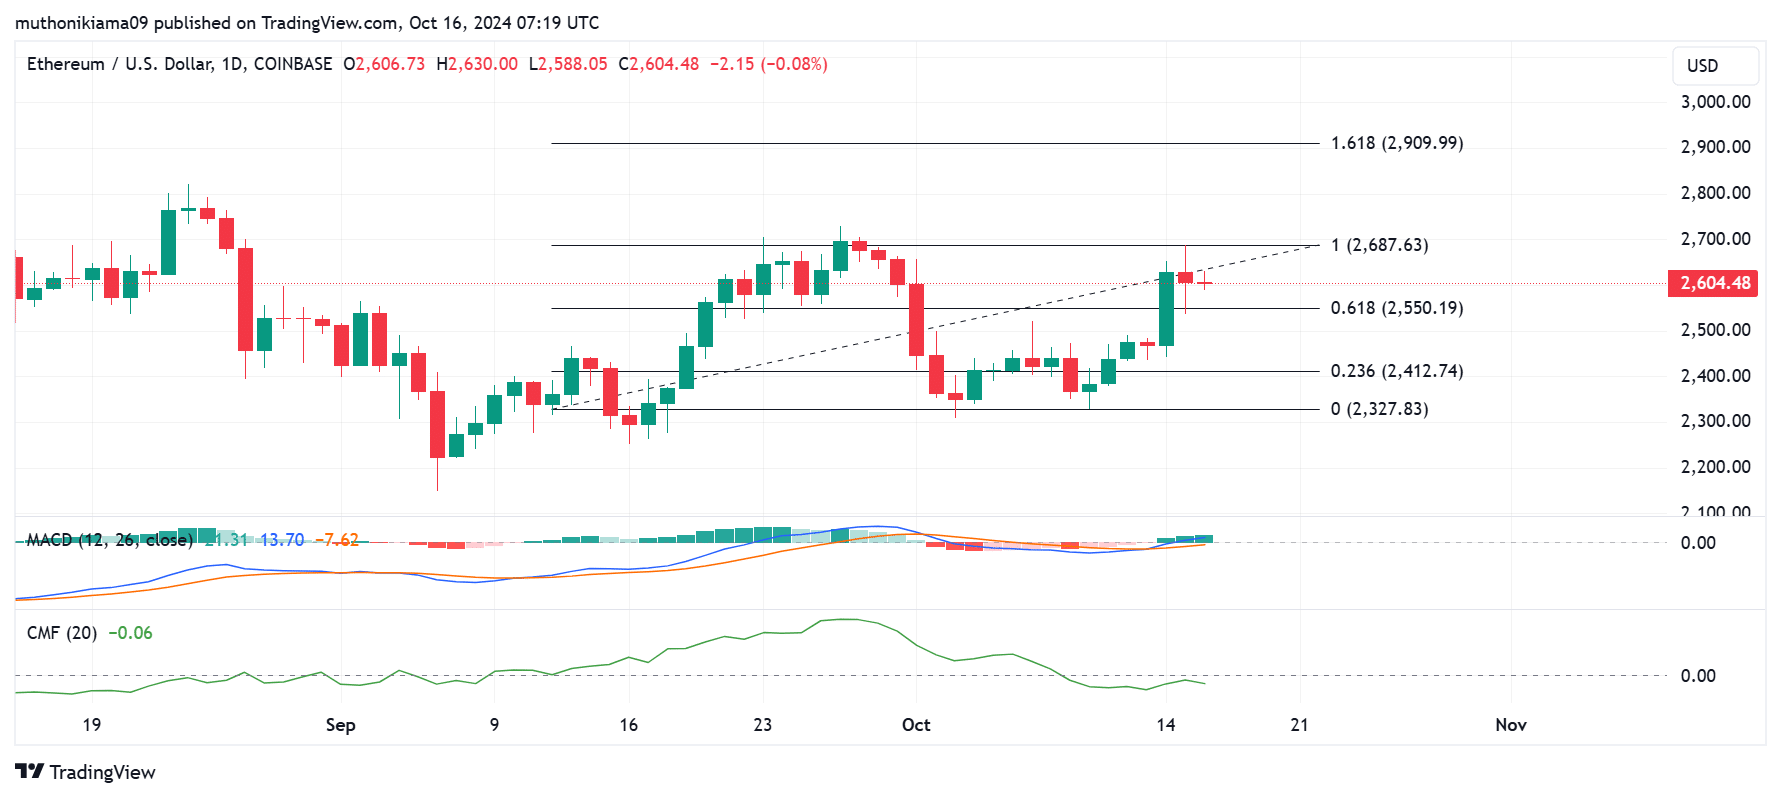
Source: TradingView
Conversely, the Chaikin Money Flow (CMF) remains negative, signaling that there is a greater outflow of capital from ETH compared to inflows.
This indicates that buyers may still be hesitant and could be waiting for ETH to breach a critical resistance level at $2,687 before entering the market.
If the bullish divergence indicated by the MACD holds true, ETH could surpass this resistance level and aim for a subsequent target of $2,900. Analyzing on-chain metrics suggests that this rally is plausible.
Ethereum Exchange Outflows Reach Two-Week Peak
Ethereum outflows from exchanges rose to a two-week peak on October 15th, as traders withdrew their tokens, indicating a lack of intention to sell.
On that day, ETH outflows totaled 589,611, which is valued at over $1.5 billion.
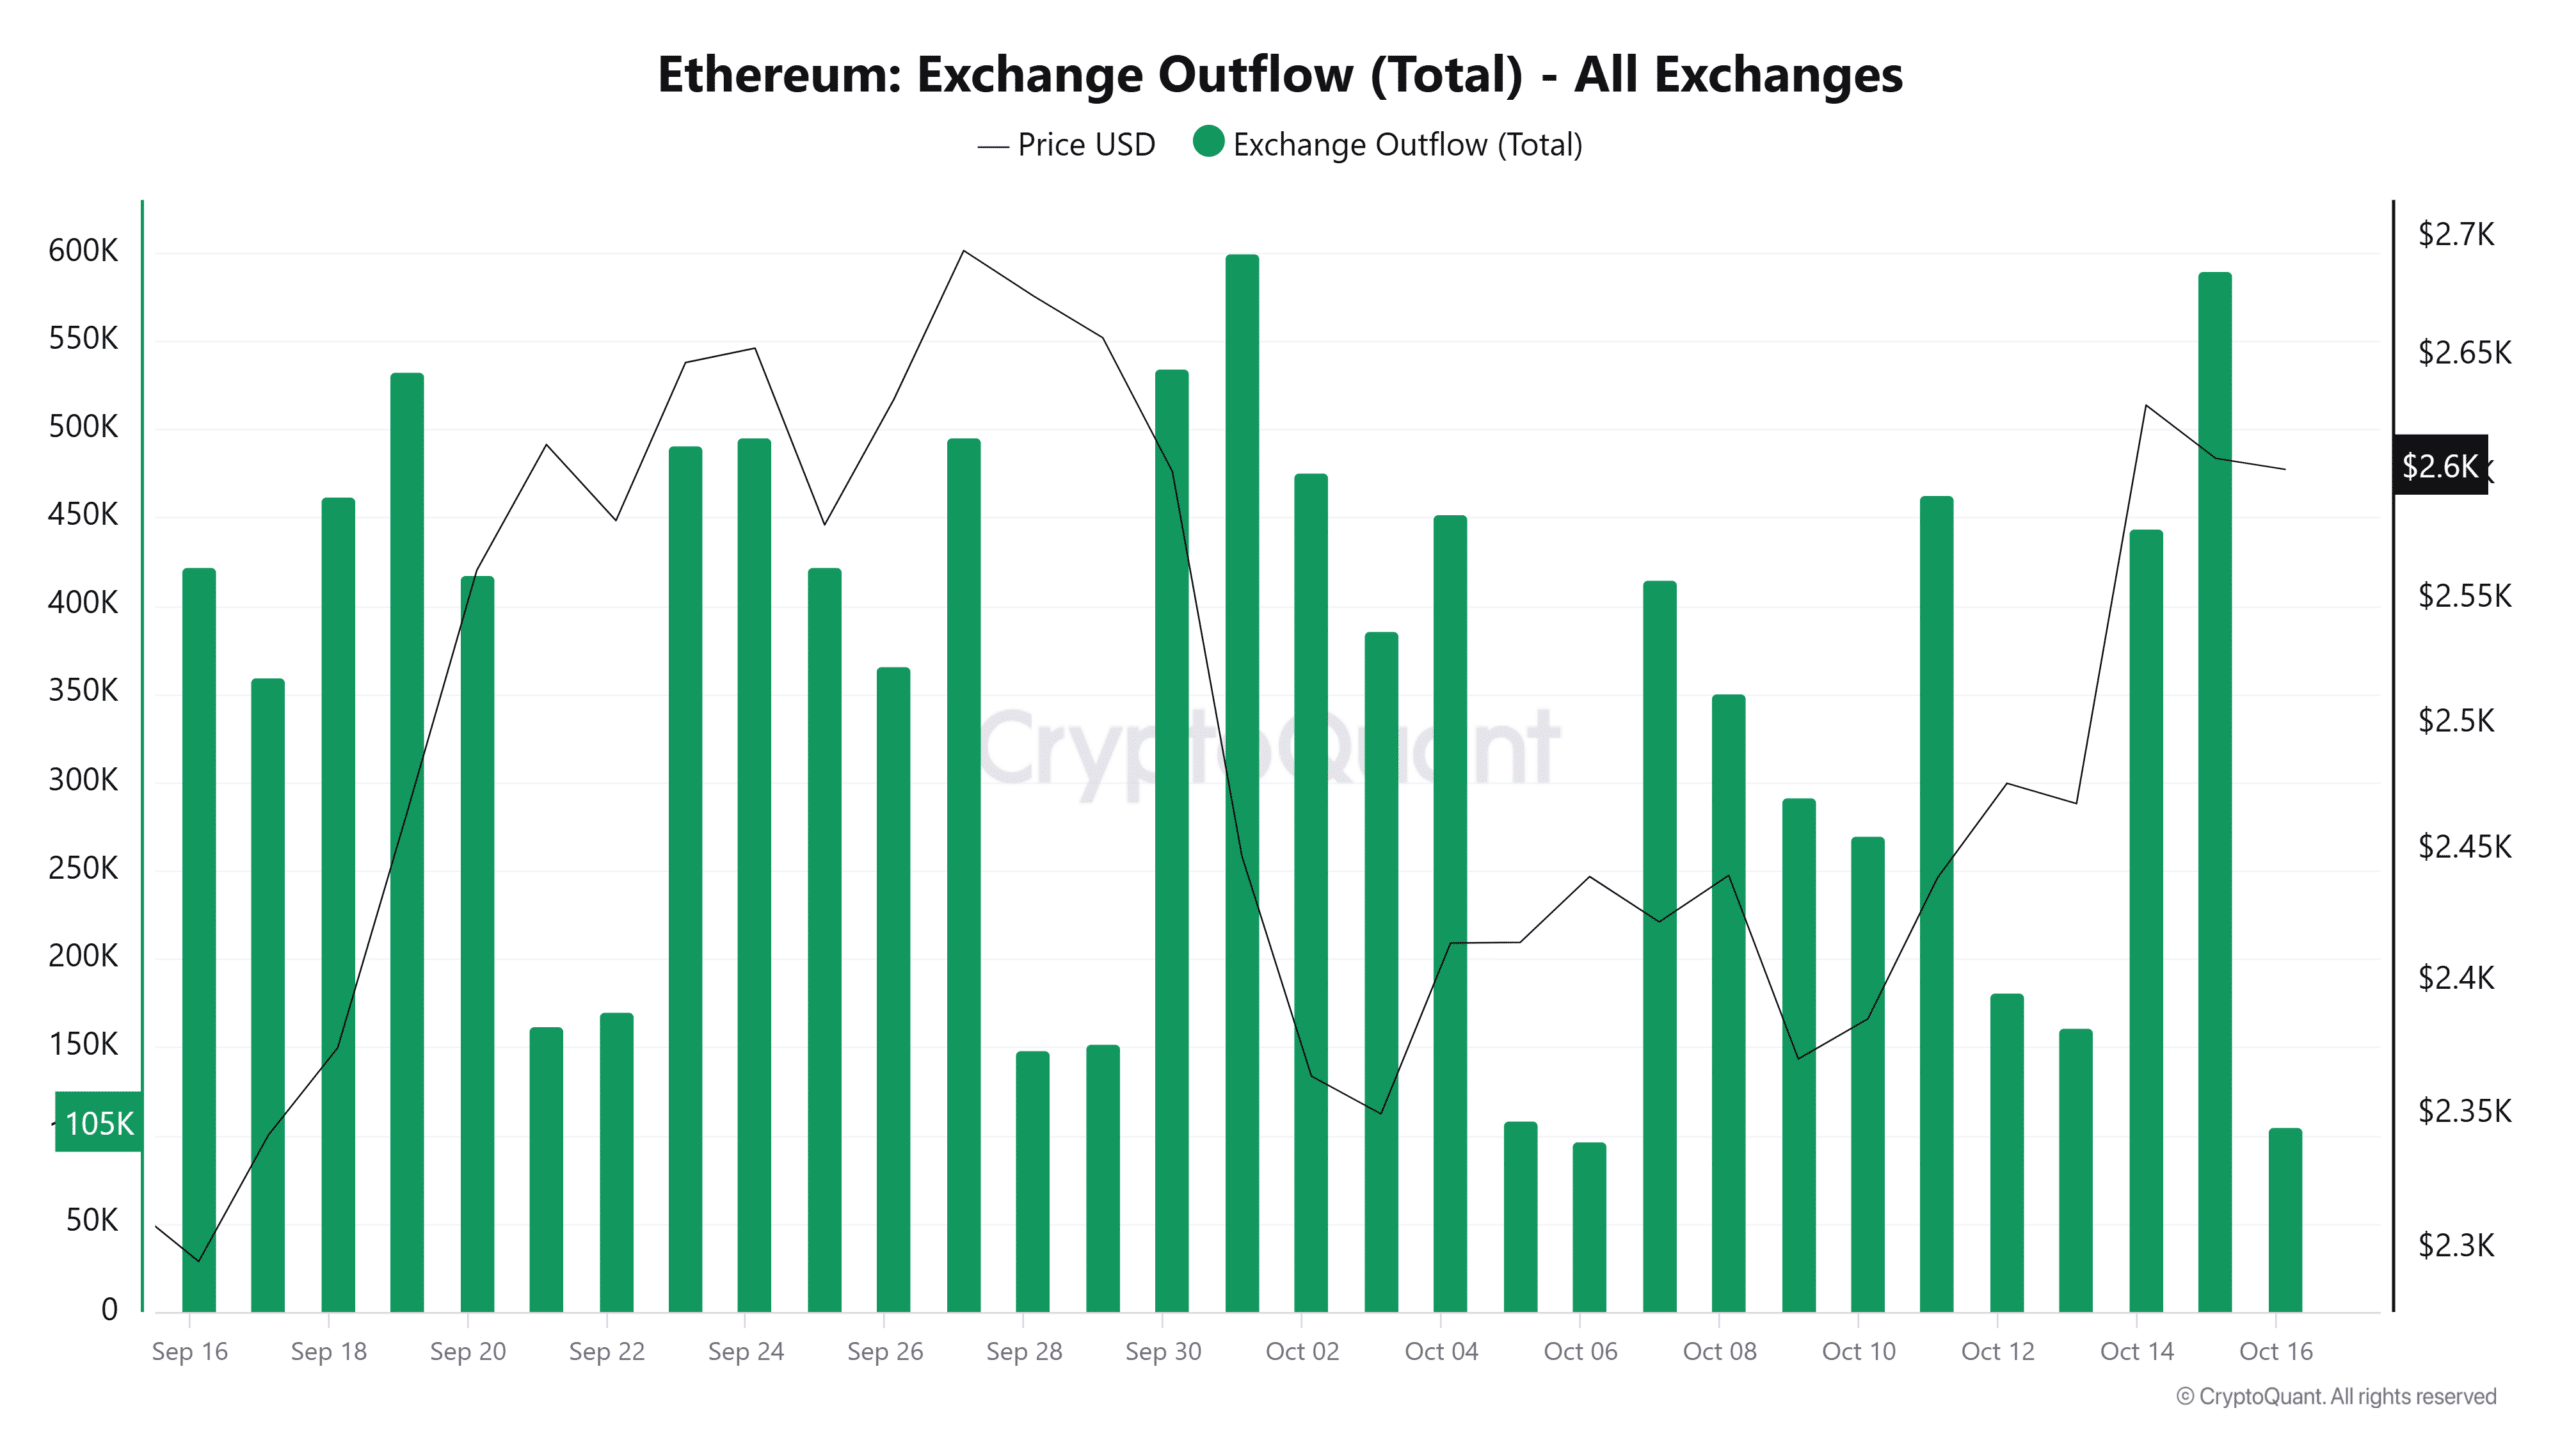
Source: CryptoQuant
As a result, the net flows of Ethereum reached their highest since late September, suggesting that the selling pressure on ETH might decrease, allowing for a price rebound.
Increasing Open Interest
Ethereum’s Open Interest could also affect price movements. Currently, Ethereum’s OI sits at $12.76 billion, indicating an uptrend in market engagement and interest from derivative traders.
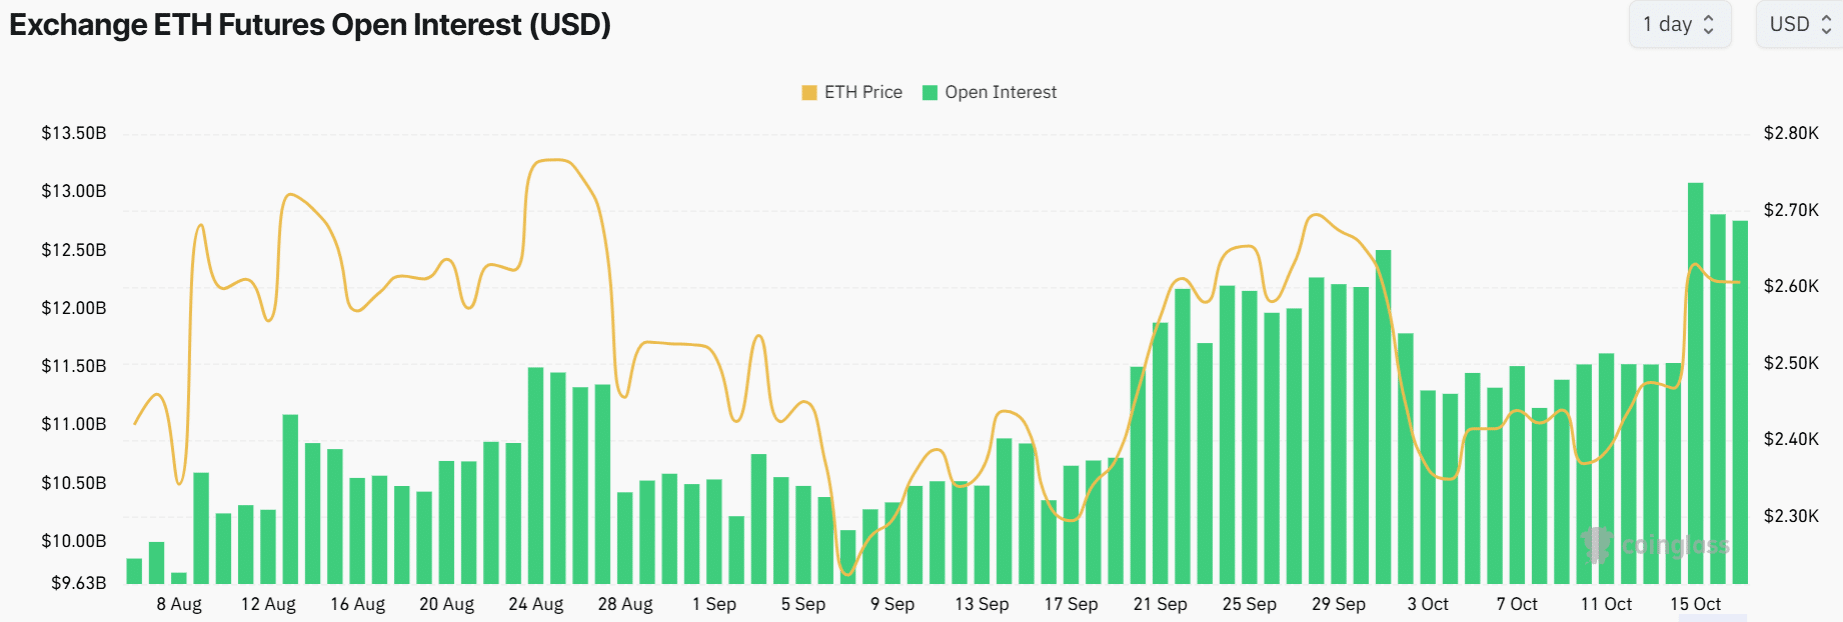
Source: Coinglass
A rise in Open Interest alongside minimal price fluctuations indicates that speculative activities concerning ETH are on the rise.
This could lead to heightened volatility if traders start to liquidate their positions following strong price movements in either direction.
Active Addresses Display Bullish Trends
The count of active addresses on Ethereum reached 349,507 on October 15th, marking the highest level in a month. This increase is indicative of growing demand for ETH or increasing network activities.
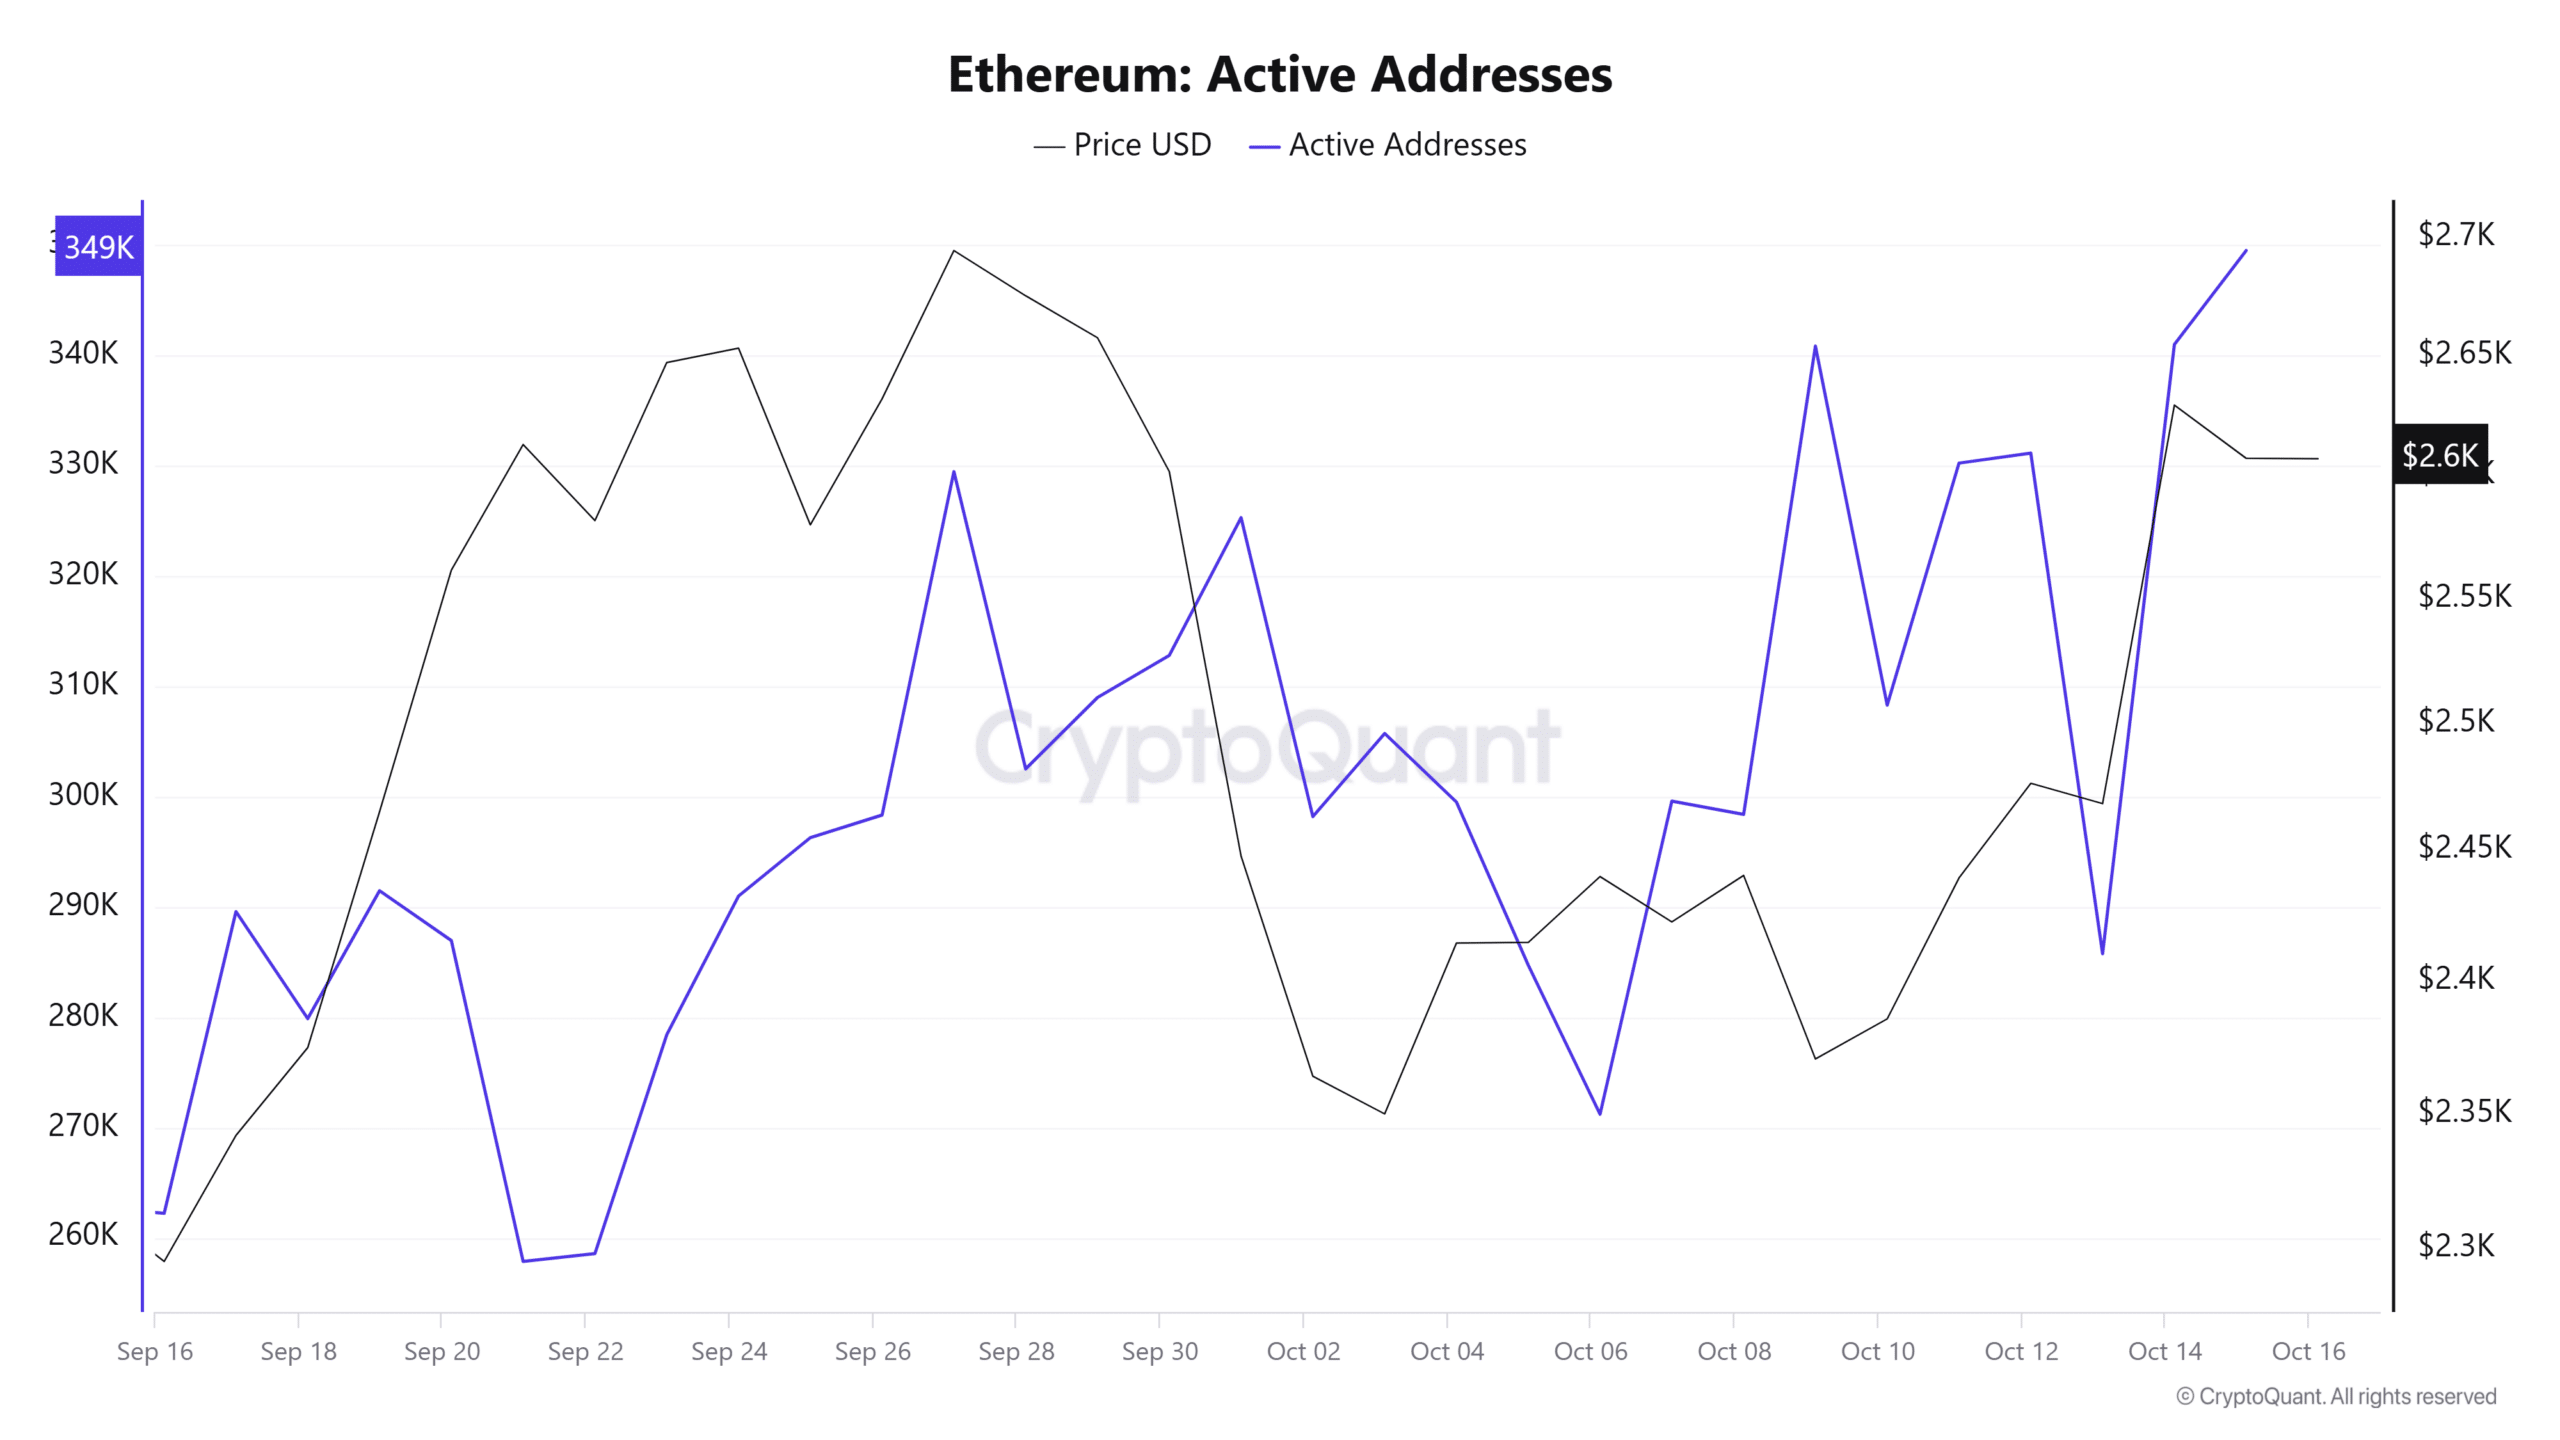
Source: CryptoQuant
The rise in active addresses also aligns with an increase in profitability.
Read Ethereum’s [ETH] Price Prediction 2024–2025
According to data from IntoTheBlock, following the recent rise in price, the proportion of daily active addresses in profit has reached 30%, the highest in the last month.
Simultaneously, the percentage of daily active Ethereum addresses registering losses has decreased to 13%.
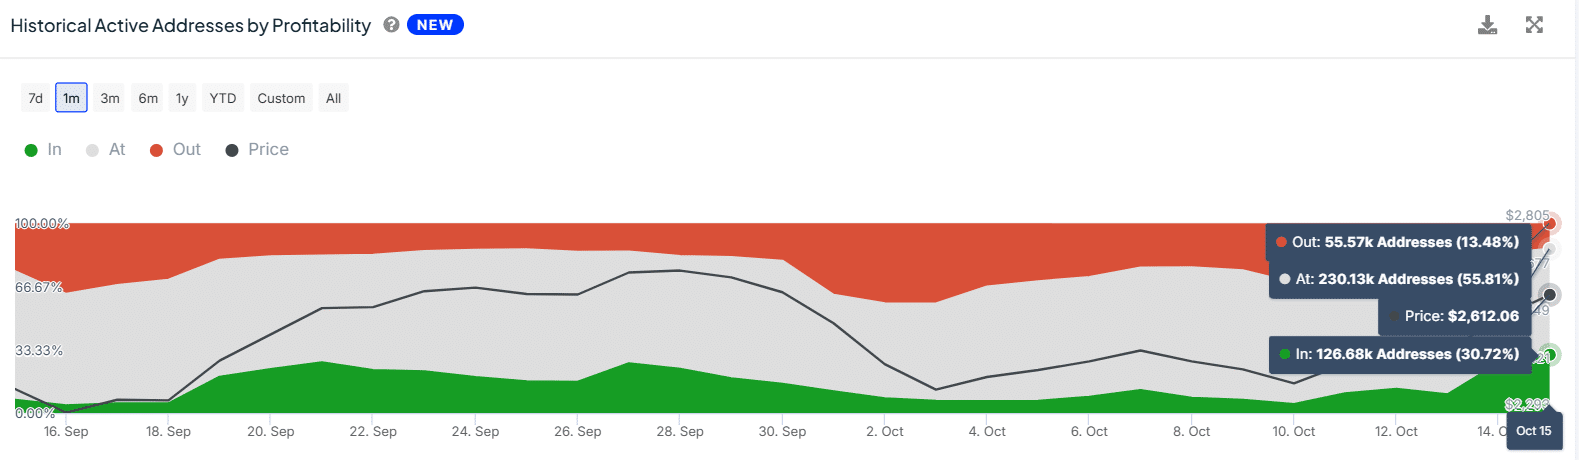
Source: IntoTheBlock


 Dutch
Dutch English
 French
 German
 Greek
Greek Italian
 Portuguese
 Russian
 Spanish