


The price of Dogecoin (DOGE) has recently exhibited both encouraging gains and some cautionary signals. Although it has experienced notable upward movements, there remains uncertainty about its ability to maintain this momentum. Traders are vigilant as the coin nears critical resistance levels that could influence its future direction.
Simultaneously, there are indications that DOGE might encounter difficulties in preserving its newfound strength. The upcoming days are likely to be crucial in shaping its short-term path.
DOGE BBTrend Hits Its Highest Level Since May
DOGE’s BBTrend has recently surged to its peak since May 2024, exceeding 15, which is a clear indication of substantial bullish momentum. This high point signifies a robust upward force in the market, driven by increased buying interest and volatility.
Nonetheless, following this notable rise, the BBTrend has shown a slight decline while still remaining near the 15 mark. This suggests that the trend has not reversed yet but could be nearing a critical juncture.
The BBTrend, which refers to the Bollinger Bands Trend, is a vital technical indicator used to assess the strength and sustainability of price movements based on the extent to which the price diverges from the Bollinger Bands. Historically, DOGE’s BBTrend has crossed above 12 during significant rallies, indicating a continuation of upward momentum.
Read more: How to Purchase Dogecoin (DOGE) Anonymously: A Comprehensive Guide
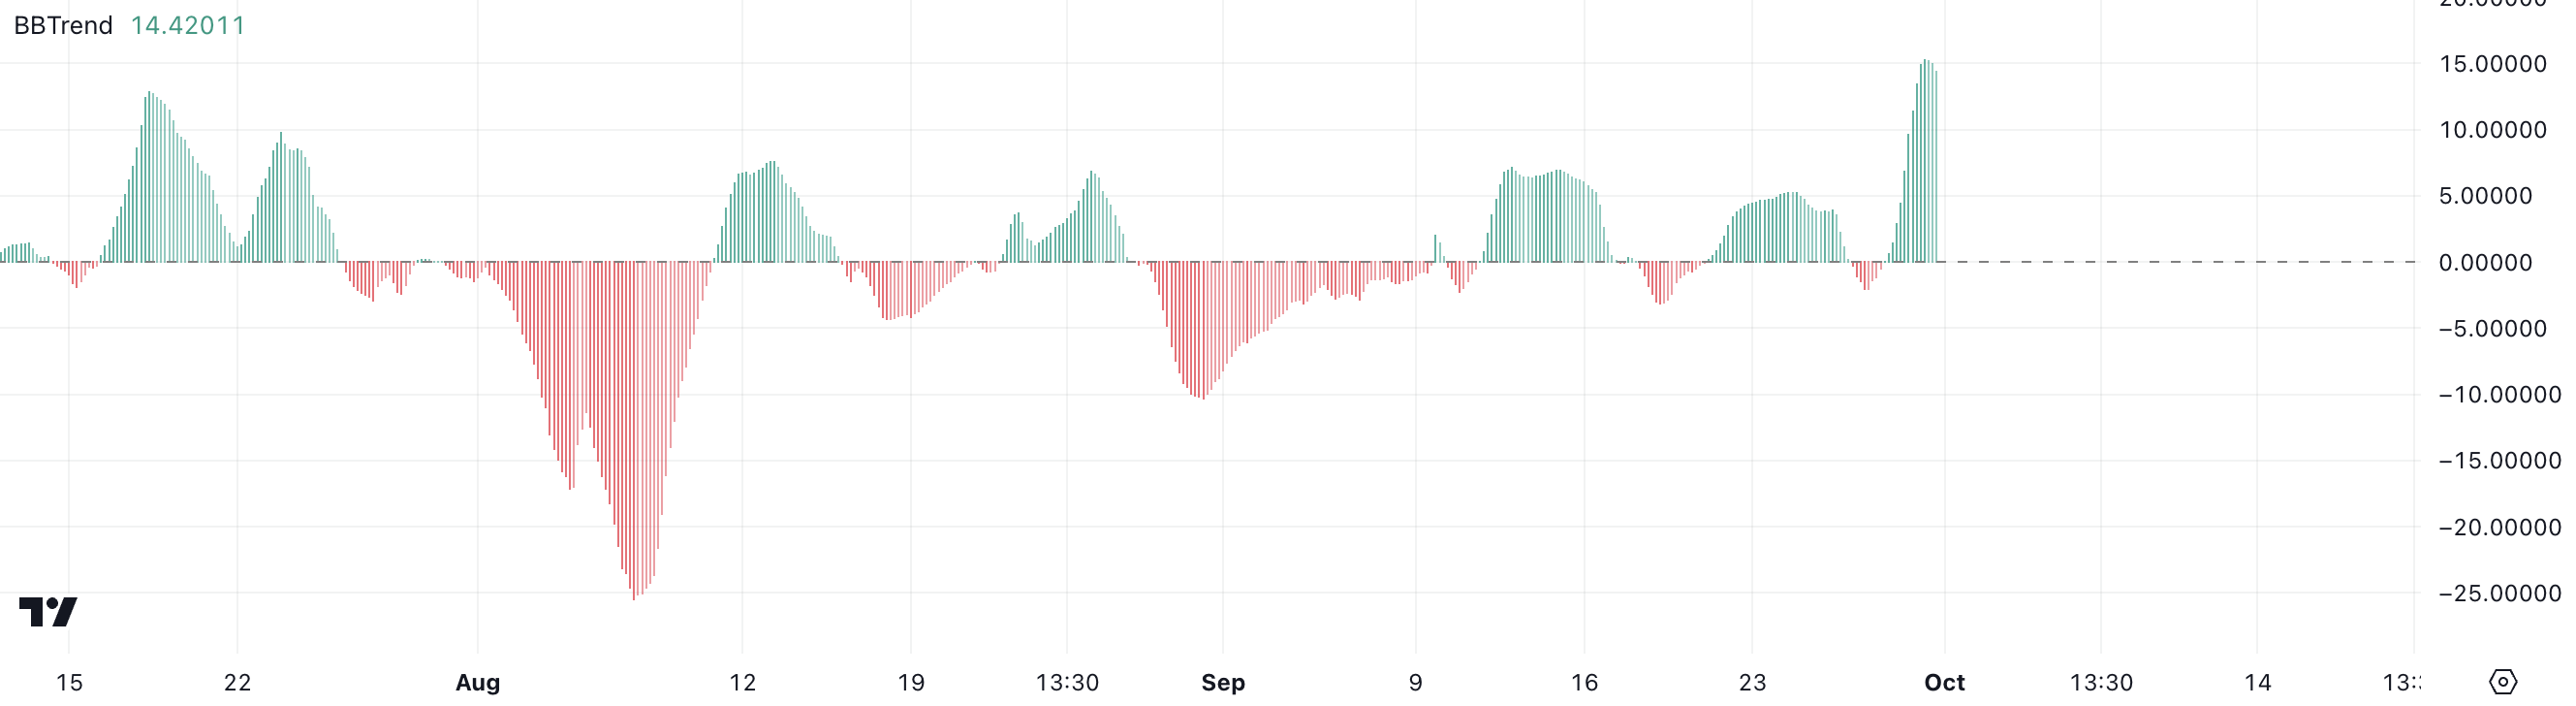
Should the BBTrend remain above this critical threshold, it could suggest that DOGE might prolong its upward trajectory and uphold its present strength. However, the recent retreat from the 15-mark raises concerns about potential exhaustion.
While a BBTrend above 12 typically indicates bullish behavior, the slight downturn might signify that DOGE’s momentum is starting to fade. There is a possibility that the coin is entering a phase of consolidation or losing steam after an extended rally.
Consequently, although DOGE has shown robust price action, it is vital to closely monitor whether it can uphold its BBTrend above 12 or if further declines will confirm a shift in market sentiment, potentially marking the conclusion of its upward momentum.
DOGE ADX Indicates Its Uptrend Is Weakening
The current ADX for DOGE stands at 33.68, down from a recent high of 45.69 over the past few days. This decline suggests that while the trend still holds some strength, DOGE’s price might be beginning to lose momentum. The ADX, or Average Directional Index, is a critical tool for measuring the strength of a trend, regardless of its direction.
Generally, an ADX above 25 signifies a strong trend, while a reading below 20 indicates a weak or non-trending market. Higher figures, such as those near 45, denote a very powerful trend, which DOGE previously demonstrated. With the ADX now decreasing to 33.68, it remains at a healthy level, indicating that the upward trend persists.
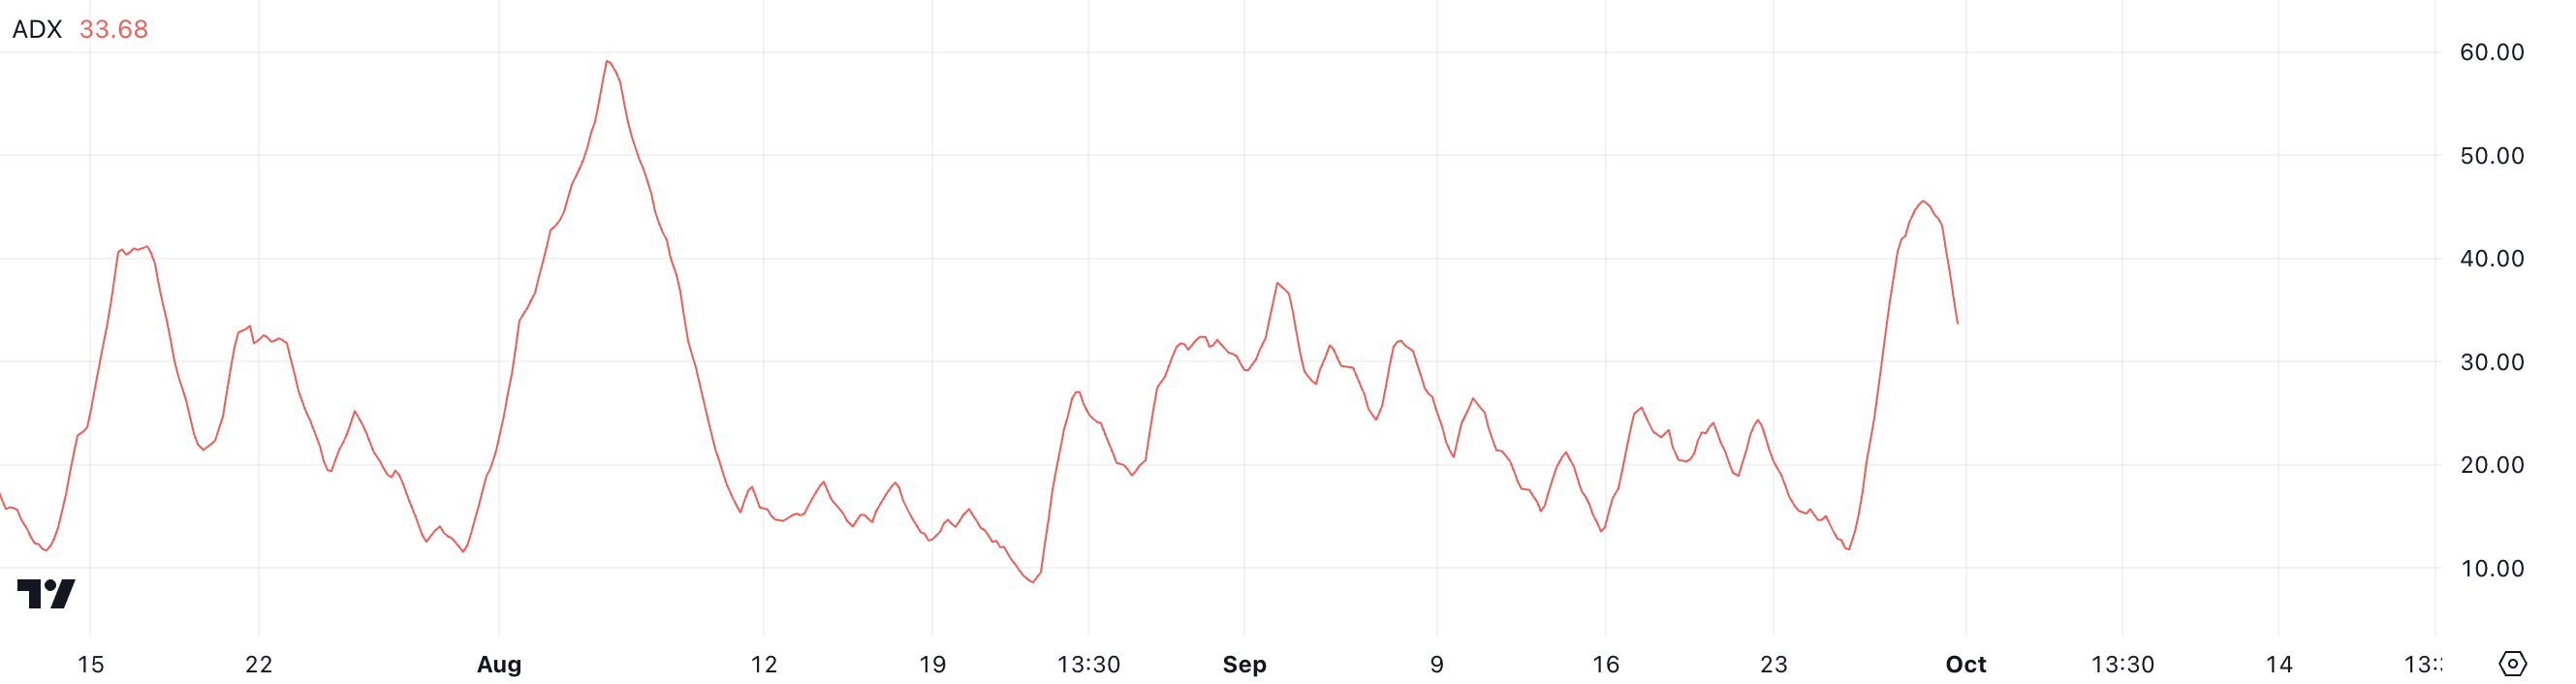
Nevertheless, the substantial pullback from its previous high raises a cautionary flag. Although 33.68 is still regarded as robust and indicates that DOGE’s price movement has not entirely lost its momentum, the decline from 45 could suggest that the bullish energy is beginning to wane.
This decreasing trend strength might imply that the excitement propelling DOGE’s recent price surge is diminishing. Should the ADX continue to decrease, it could indicate that the uptrend is vulnerable to reversal or might be entering a phase of consolidation.
DOGE Price Outlook: Can It Surpass the $0.14 Mark in October?
DOGE’s EMA lines are currently positioned in a bullish arrangement, having recently experienced a golden cross just a few days ago that spurred a sharp 30% price increase. A golden cross occurs when the short-term Exponential Moving Average (EMA) crosses above the long-term EMA, indicating a potential upward trend.
While these EMAs maintain their bullish indications, the short-term EMA has recently begun to decline significantly. This drop in the short-term EMA could serve as an early warning sign that DOGE’s momentum might be slowing.
EMA lines smooth out price data by giving more weight to recent prices, aiding traders in better identifying trends. For DOGE, these EMAs initially showed a strong uptrend, but the weakening of the short-term line may signal a shift in market sentiment.
Read more: Dogecoin (DOGE) vs. Shiba Inu (SHIB): What Are the Differences?
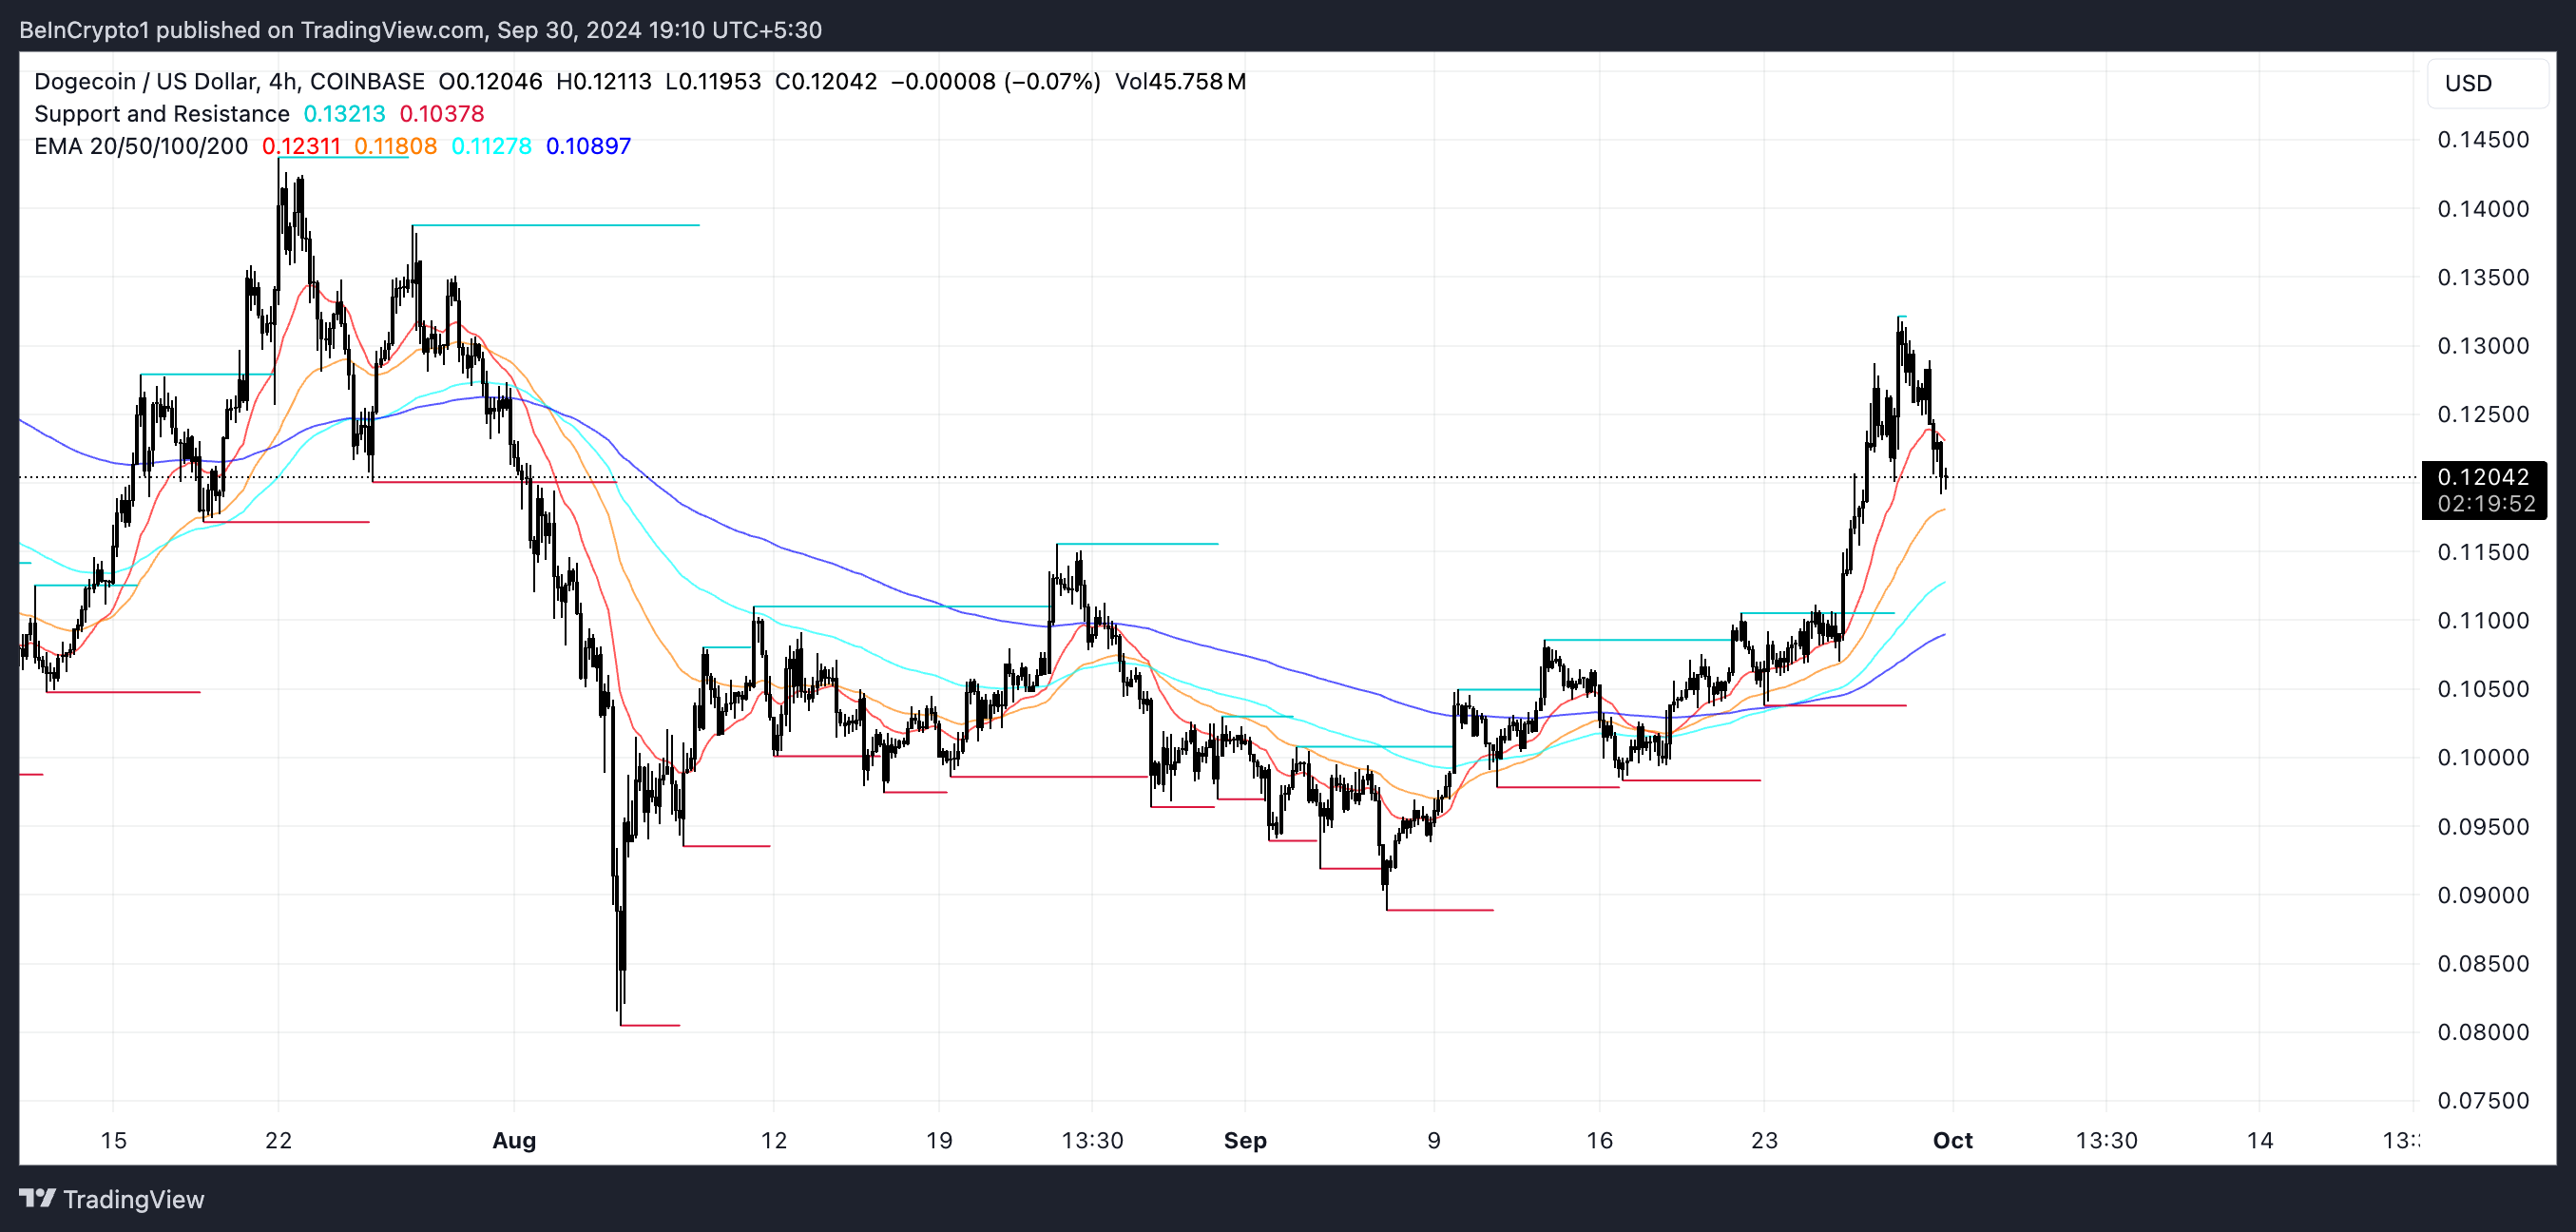
DOGE has encountered difficulties breaking through significant resistance levels at $0.135 and $0.128. These levels have remained intact despite the recent surge, and should DOGE succeed in surpassing them, it could quickly touch $0.14. However, the declining ADX, which gauges trend strength, suggests that bullish momentum is diminishing as other meme coins garner more attention.
With the ADX losing its vitality, the trend may lack the strength necessary to propel DOGE past these resistance barriers, potentially leading to a reversal. If such a scenario unfolds, DOGE’s price could retreat to $0.098 or even down to $0.089 in the near future.
Disclaimer
In accordance with the Trust Project guidelines, this price analysis article is for informational purposes only and should not be interpreted as financial or investment advice. BeInCrypto strives for accurate and impartial reporting, but market conditions are subject to change without notice. Always perform your own research and consult with a professional before making any financial decisions. Please be aware that our Terms and Conditions, Privacy Policy, and Disclaimers have been revised.


 Dutch
Dutch English
 French
 German
 Greek
Greek Italian
 Portuguese
 Russian
 Spanish