Bitcoin (BTC) has made a significant leap, surpassing the important $65,000 mark and igniting renewed optimism about reaching its historical peak. As bullish momentum continues to build, the market is closely monitoring if this breakthrough could signal the beginning of a larger uptrend. With previous barriers now behind it, can Bitcoin maintain its ascent and reach its all-time high? Or will market dynamics halt its progress before achieving new heights?
This article aims to investigate BTC’s remarkable move past the $65,000 level and assess its chances of hitting a new record peak. It will provide a thorough perspective on whether BTC can uphold its rally or encounter resistance as it nears historical territory, through an in-depth analysis of current market trends, increasing strength, and potential hurdles.
Implications of Breaking the $65,000 Barrier for Bitcoin
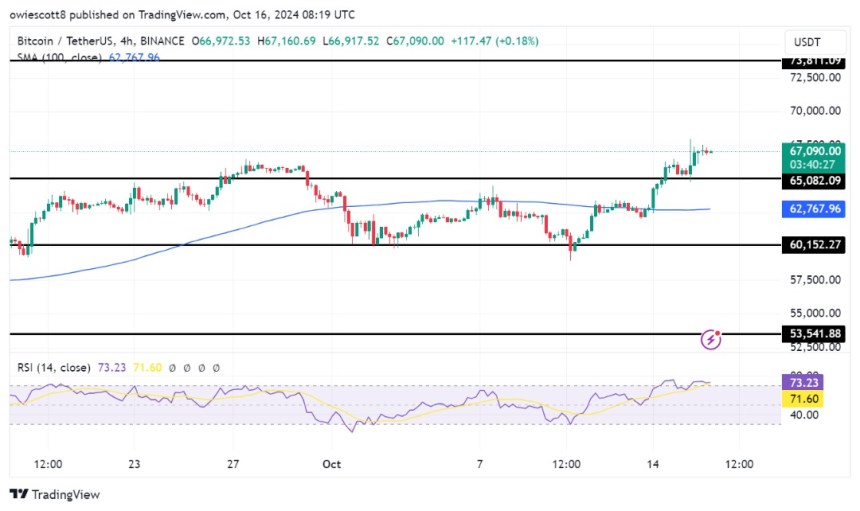
At present, on the 4-hour chart, Bitcoin is holding steady after successfully breaching the $65,000 threshold while trading above the 100-day Simple Moving Average (SMA). By staying above the $65,000 level and the 100-day SMA, BTC showcases its strength and the potential for further upward movement towards the all-time high of $73,811.

An examination of the 4-hour Relative Strength Index (RSI) reveals a notable increase, climbing to 77% from 50%, indicating substantial bullish pressure for Bitcoin. While this rise points to increasing positive market sentiment, it also raises questions about the sustainability of the rally, as profit-taking could lead to a price correction.
Related Reading
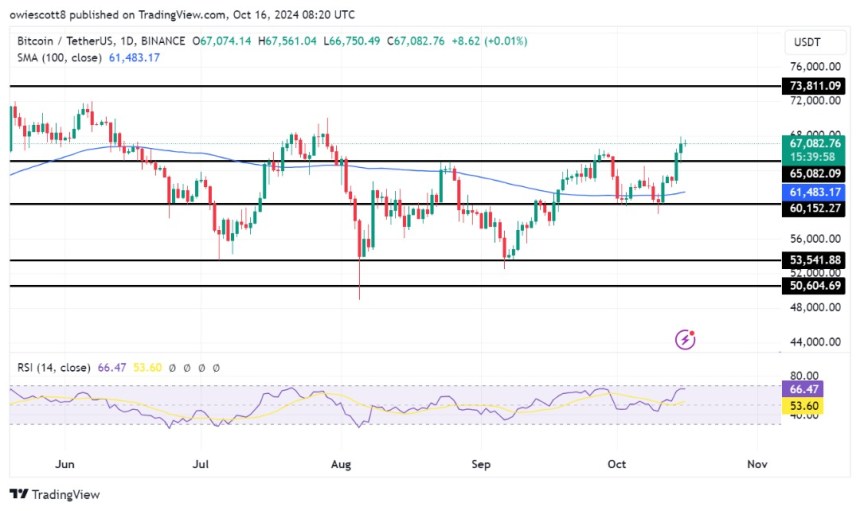
Moreover, the daily chart shows that Bitcoin is trading above the 100-day SMA, which highlights a strong bullish momentum. This upward trend is highlighted by a bounce off the $65,000 level, showing significant buying enthusiasm from investors. The consistent positioning of BTC above the 100-day SMA signals a strong trend, with bulls eager to drive prices higher, likely leading to more upward movement if momentum persists.

Finally, the daily chart RSI currently sits at 66%, well above the crucial 50% mark, indicating a bullish trend for Bitcoin. At this level, the RSI suggests that BTC’s positive momentum may continue, supporting the likelihood of further price increases in the near term as it has yet to reach overbought levels.
Technical Analysis: Insights from BTC’s Charts
A technical analysis for Bitcoin suggests a cautiously optimistic outlook as the cryptocurrency holds its ground above essential support levels. Consequently, the next resistance level to watch is its existing all-time high of $73,811. A successful breakthrough above this price could set the stage for Bitcoin to achieve new heights, potentially establishing a new record.
Related Reading
However, if sellers gain control at the $73,811 resistance level, the price may face a downward trend towards the $65,000 support zone. Furthermore, a decline below this point may catalyze a deeper drop, potentially testing the $60,000 support level and beyond.
Featured image from Unsplash, chart from Tradingview.com


