


Bitcoin stands at a pivotal point after several weeks of significant volatility characterized by both excitement and apprehension. Currently priced at approximately $59,400, BTC is probing important demand levels following a 10% decline from recent peaks near $66,000.
This latest fluctuation in price has created a sense of uncertainty among investors, with some still nurturing hopes for new all-time highs in this market cycle. Many are keeping a close eye on Bitcoin’s subsequent actions as the cryptocurrency market responds to external influences.
A prominent crypto analyst has revealed a long-term chart that illustrates a fascinating trend: historically, October has often marked the start of bullish phases for BTC. This observation injects a note of optimism for those aiming to take advantage of possible upward movement.
As market sentiment remains mixed, the focus is on Bitcoin to see if it can recover its previous losses and surge toward new highs.
The upcoming days will be crucial as traders evaluate whether BTC can sustain a bullish path or if additional corrections are on the horizon. Given historical trends and the current market landscape, investors are eagerly anticipating how this story will unfold.
Is a Bitcoin Post-Halving Surge Approaching?
Bitcoin is presently navigating a highly unstable market, leaving traders and investors in a state of unease. The price trend lacks clear direction or defined targets, which raises concerns among market players.
Many analysts worry that the expected historical bull market following the recent halving might not occur this time, potentially resulting in lost opportunities for significant profits.
Nonetheless, renowned crypto analyst Ali provides a spark of optimism. He recently shared an insightful technical analysis on X, featuring a chart that highlights an important trend: every major Bitcoin upsurge has historically begun in October during halving years.

According to this analysis, Bitcoin has historically initiated parabolic bull runs every October post-halving, leading many to believe that the current cycle might follow this trend. This historical data has encouraged various traders and investors to hold onto their assets, hoping for a price resurgence.
This strategy could yield significant profits for some, while also posing risks for those who may be overly optimistic, particularly if BTC falls short of expectations.
As October progresses, the market remains in a state of anticipation. Traders are aware that the coming weeks will be crucial in shaping Bitcoin’s direction.
Although the prospect of a bull run is enticing, the potential for further volatility and corrections persists, marking a critical juncture for investors in this ever-evolving asset. The interaction between historical trends and present market behavior will soon play a significant role in determining BTC’s future.
BTC Testing Key Demand Levels
Bitcoin is trading at $61,350 after encountering resistance at the 4-hour 200 exponential moving average (EMA), which is currently at $61,645. The price remains above the 4-hour 200 moving average (MA) situated at $60,363, an essential support level for bulls striving to regain momentum.
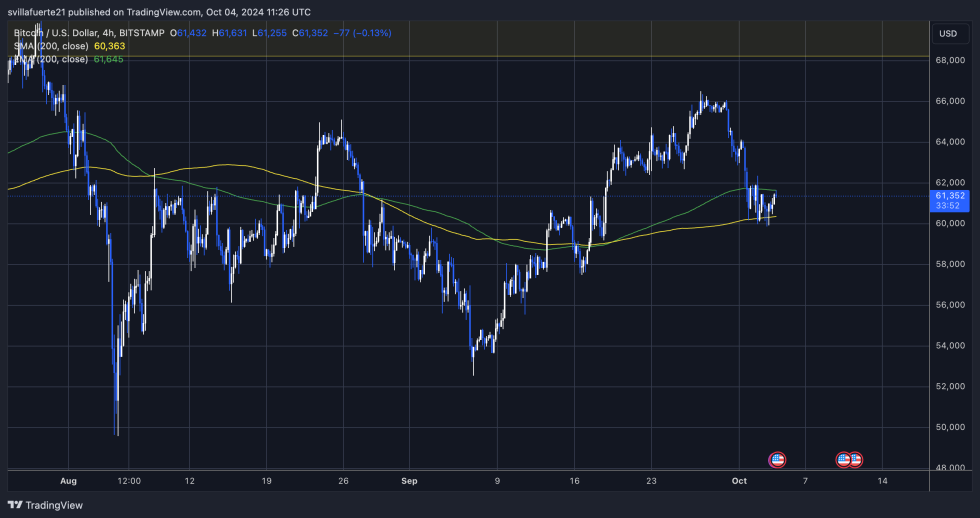
BTC needs to surpass the EMA and reach higher supply levels, especially around $66,000, to sustain the upward trend. Success in this regard could indicate strong bullish momentum as we progress into the weeks ahead.
Conversely, if it fails to stay above the 4-hour 200 MA, it may result in a deeper correction, with targets potentially around $57,500 or even further down. Traders are closely observing these key indicators, as the current price movements indicate a significant crossroads for Bitcoin.
The upcoming sessions will likely determine if bulls can regain dominance or if a bearish trend will take precedence. Investors should remain attentive, as an increase in volatility could significantly impact market sentiment and price movements. The dynamics of these technical levels will be crucial for traders as they navigate the complexities of the crypto market.
Featured image from Dall-E, chart from TradingView


 Dutch
Dutch English
 French
 German
 Greek
Greek Italian
 Portuguese
 Russian
 Spanish