


Bitcoin’s recent surge in price towards $66,000 has generated increased optimism within the market; however, a potential retracement phase now looms ahead.
The $66K resistance level is emerging as a significant obstacle, and BTC is expected to experience a consolidation or correction period before establishing its next significant trend.
Technical Analysis
By Shayan
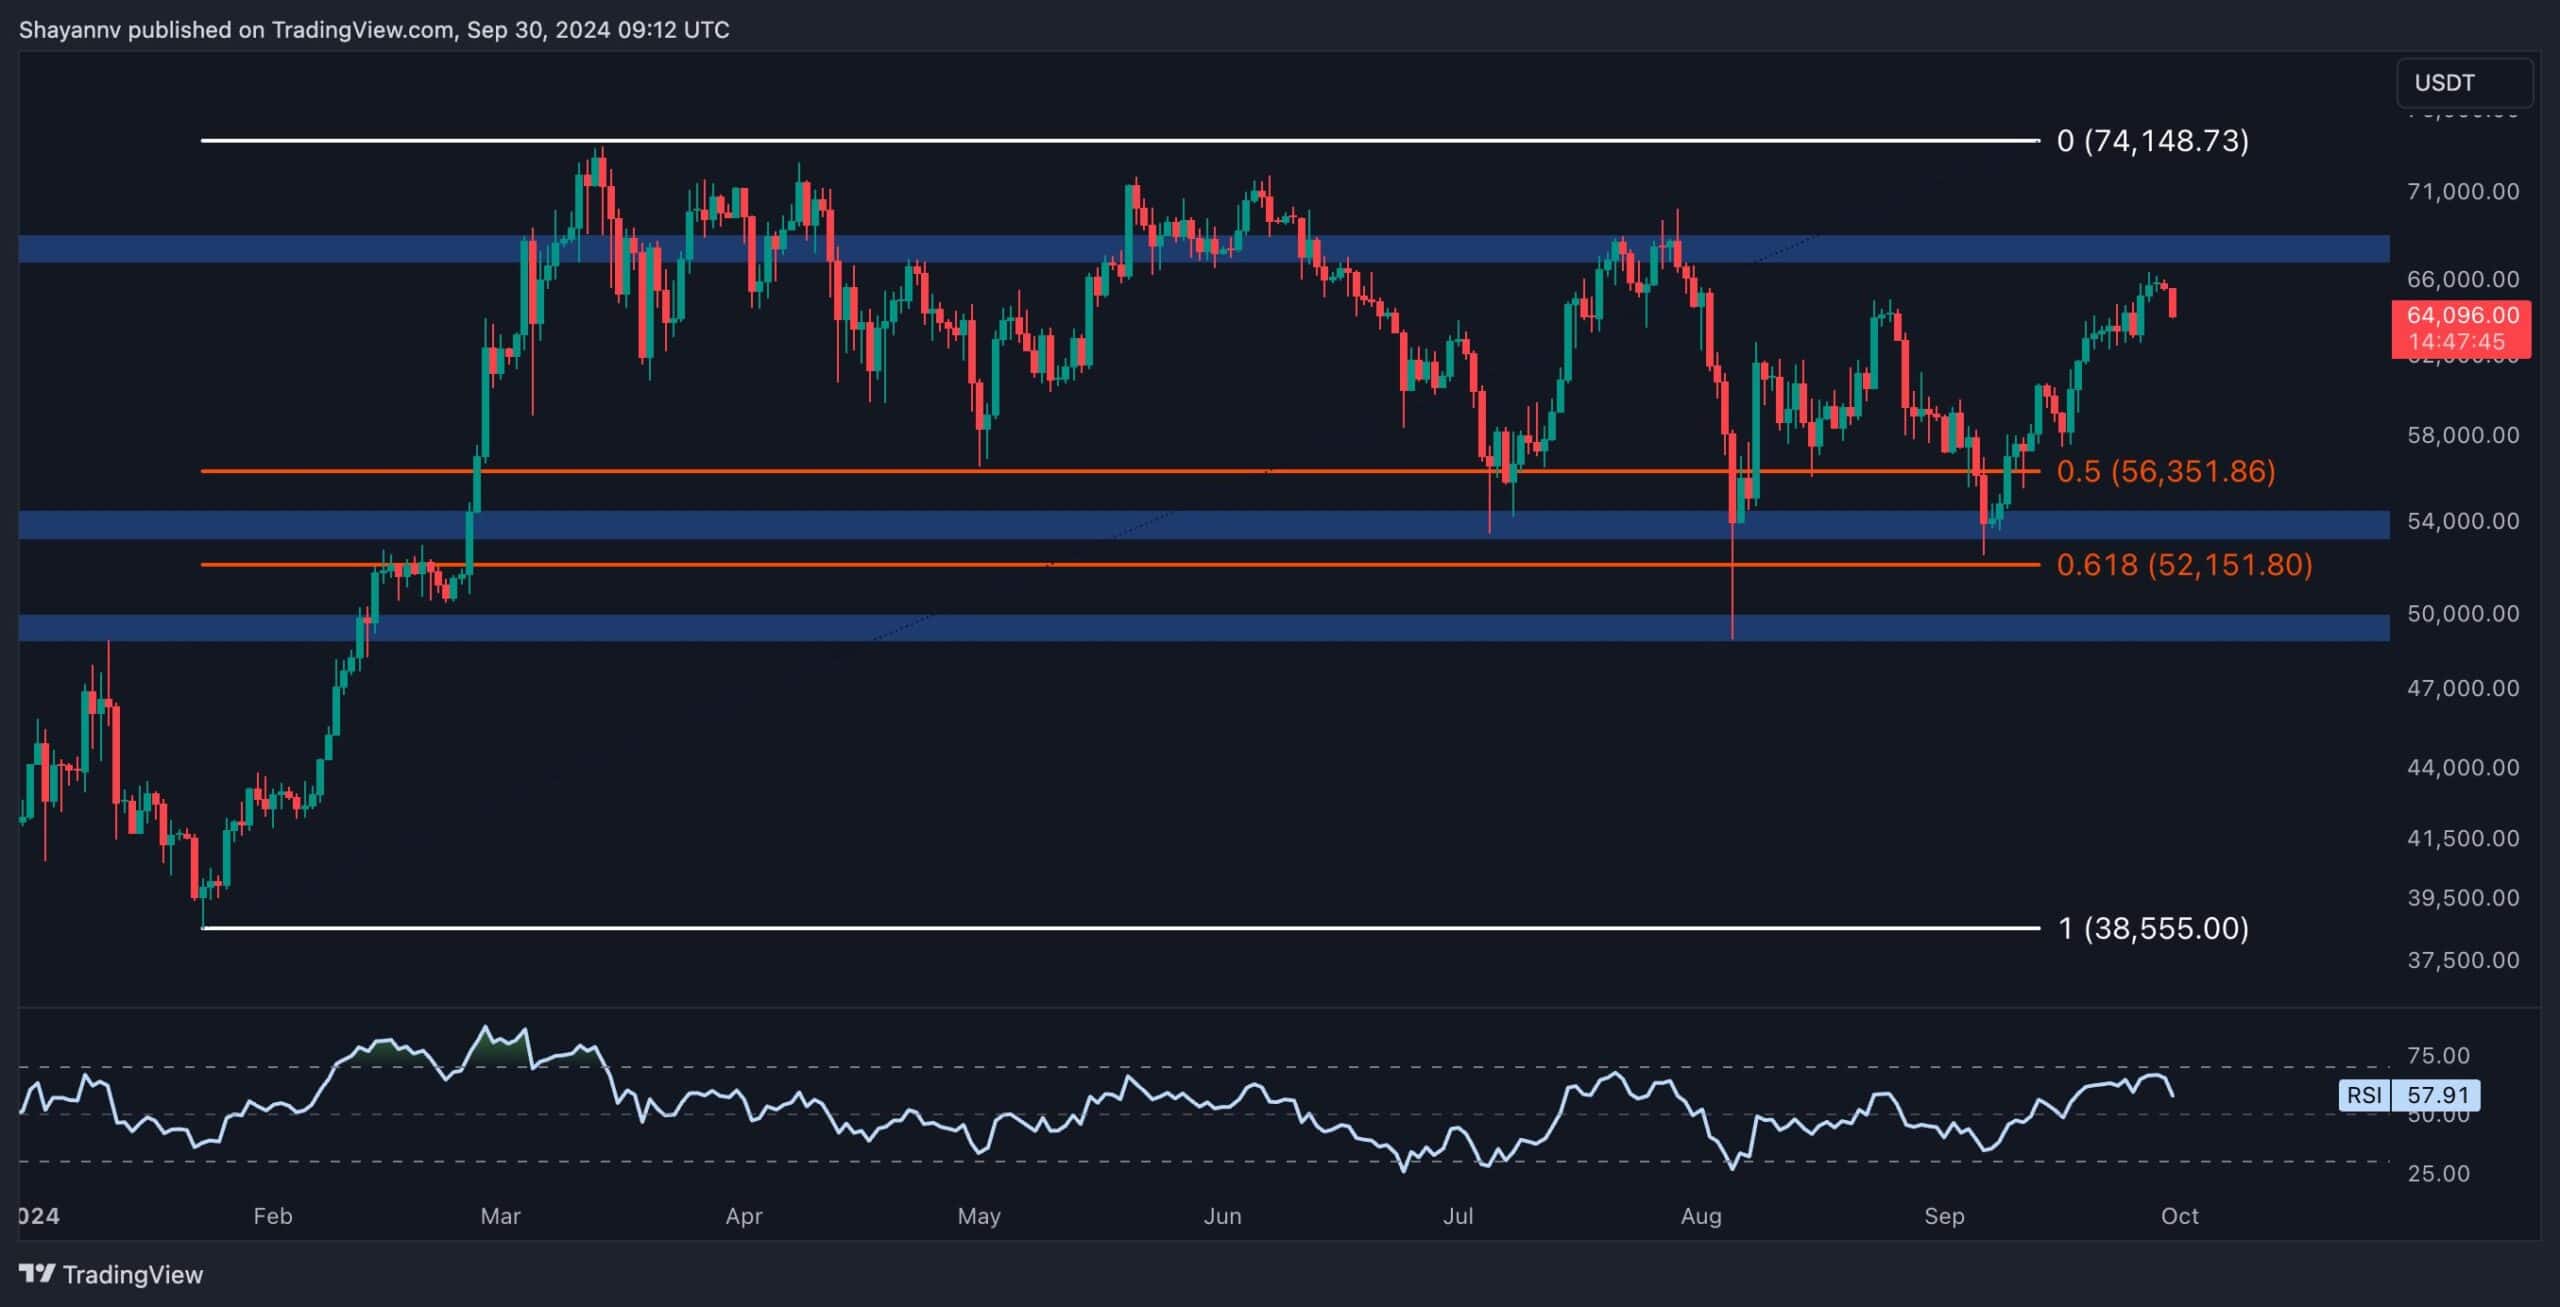
The Daily Chart
Bitcoin recently witnessed a robust bullish movement, reaching the vital $66K resistance area after starting from a key support level around $55K.
This bullish drive was fueled by enhanced market sentiment and increased buying activity. Nevertheless, as Bitcoin approached the $66K threshold, it encountered significant selling pressure, resulting in a minor rejection.
This range signifies a critical resistance level that corresponds to BTC’s previous major pivot. A substantial supply could be present at this level, creating a strong barrier to further price increases. Given the impulsive character of the recent rally, it is likely that a corrective retracement phase will occur as the market stabilizes before establishing its next major trend direction.
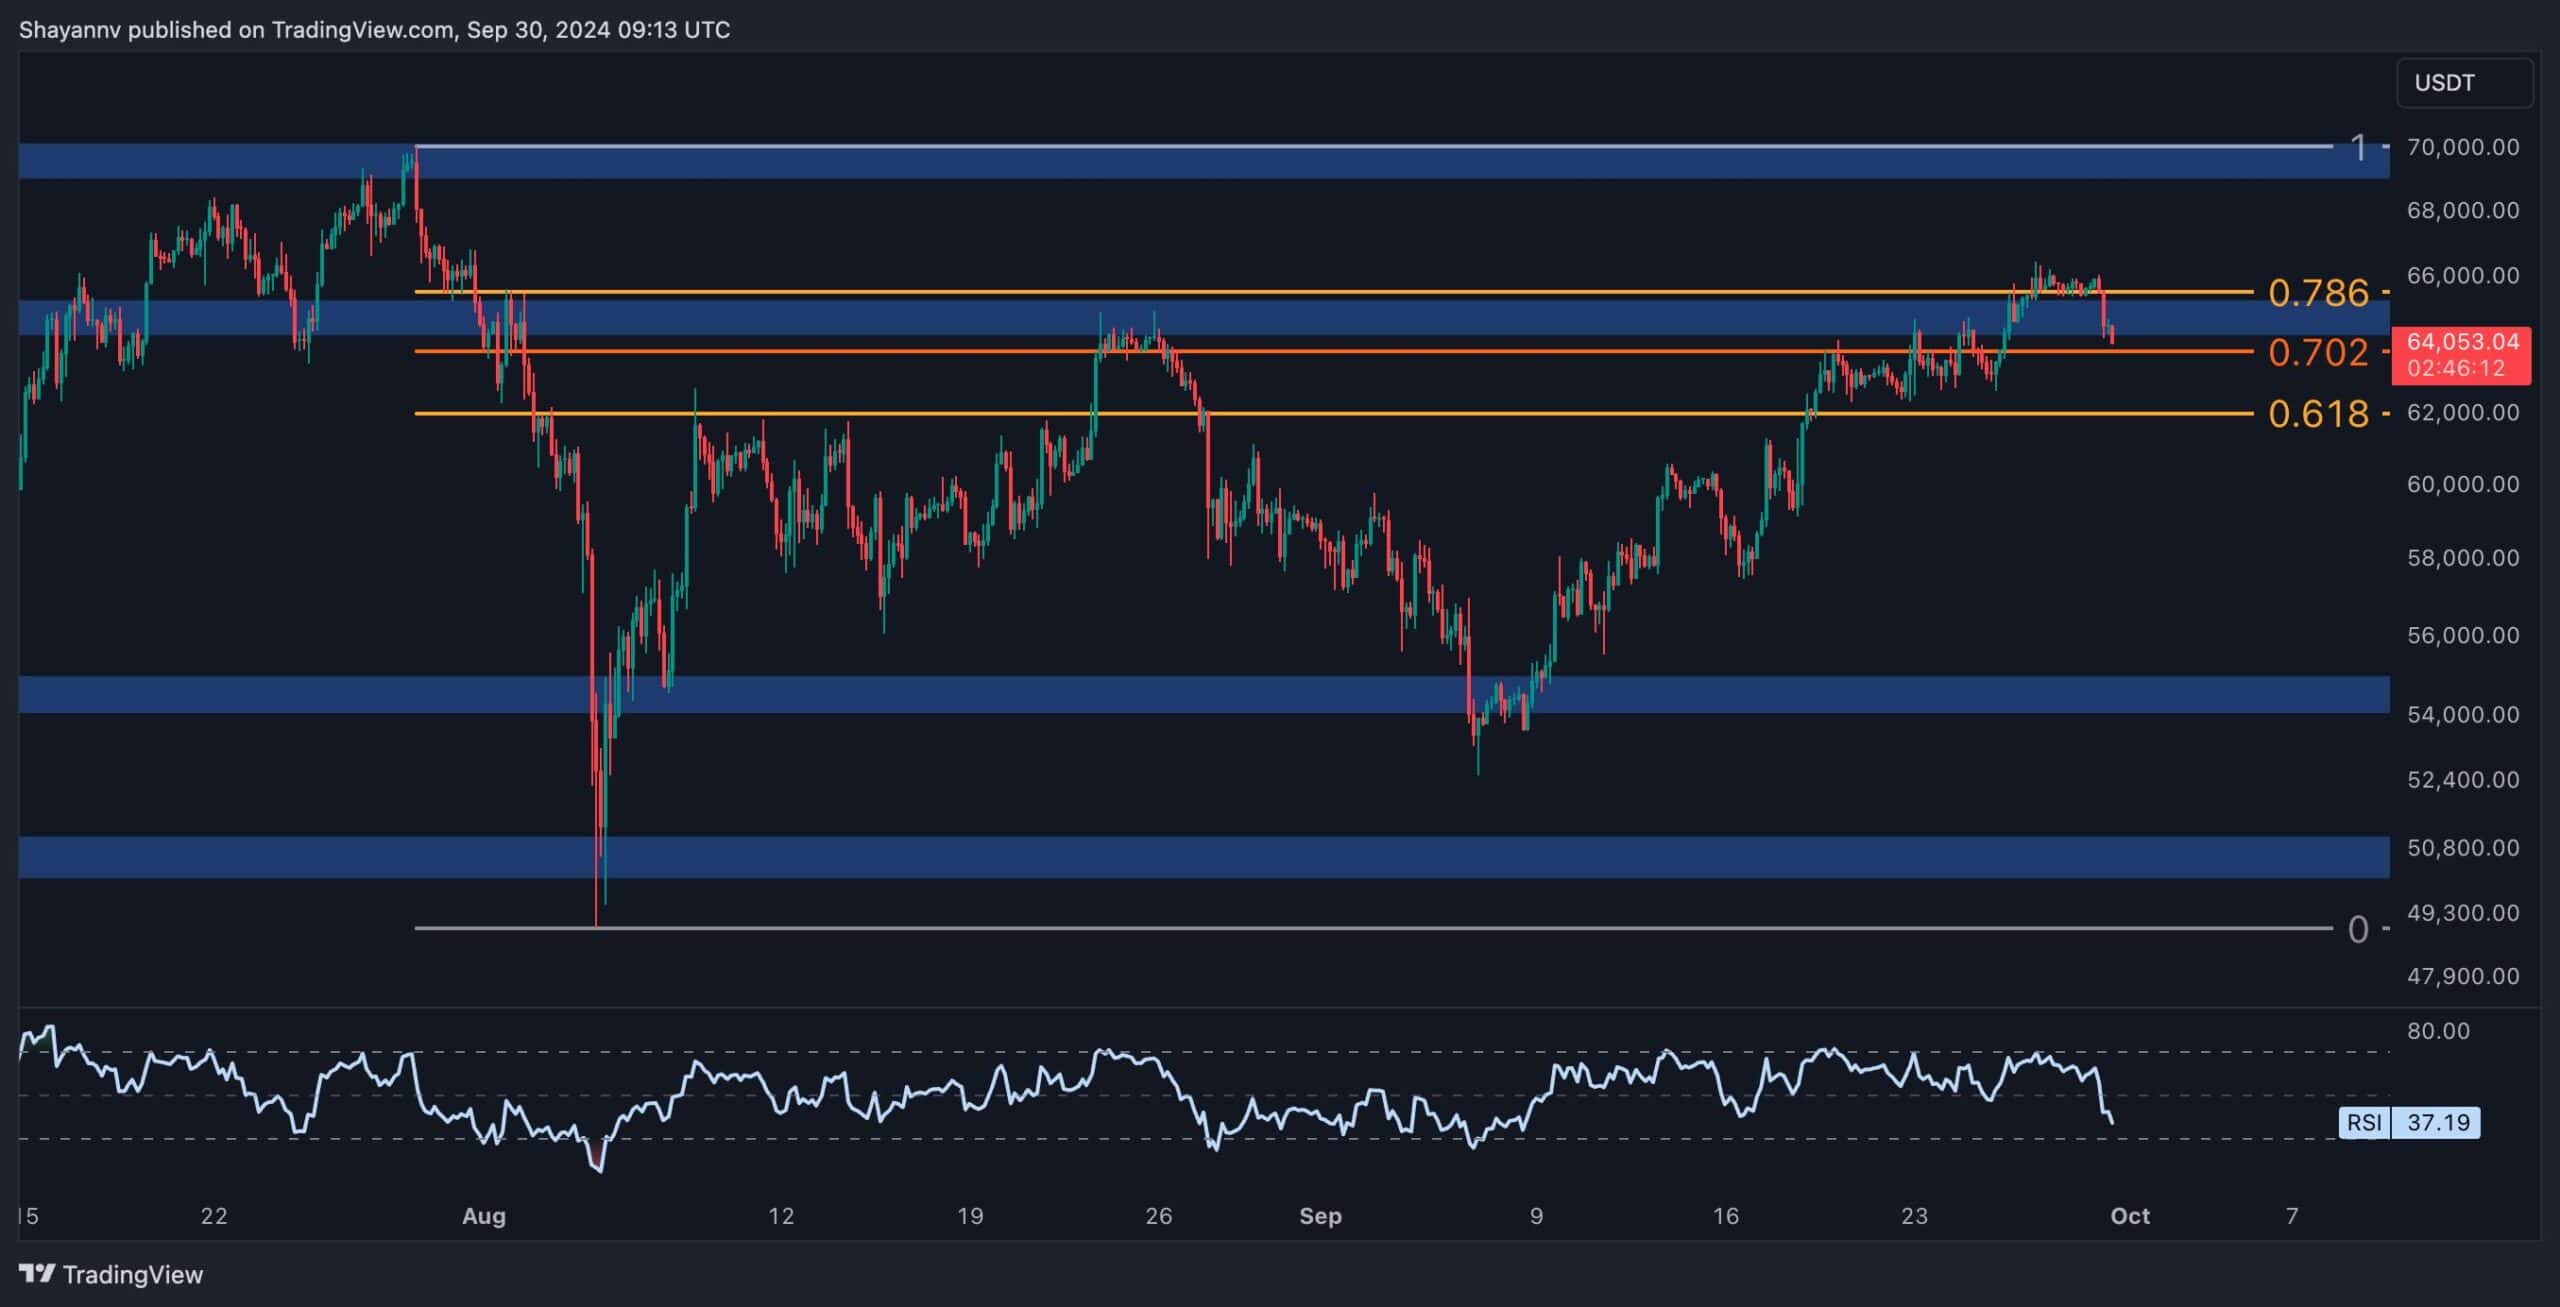
The 4-Hour Chart
In the 4-hour chart, Bitcoin’s recent price behavior indicates a series of higher highs and higher lows, establishing an upward trend from the essential $55K support area. This demand surge allowed Bitcoin to reclaim the $65K swing high, triggering a short-squeeze and attracting liquidity from existing sell orders in the region.
At present, the price has ascended to the area between the 0.618 and 0.786 Fibonacci retracement levels, identified as the Optimal Trade Entry (OTE) levels. This zone typically serves as a major resistance level, and Bitcoin has already faced increased selling pressure, resulting in a minor rejection from this range.
Considering the current market dynamics, Bitcoin is anticipated to enter a short-term corrective retracement phase, with a primary target of the $60K psychological support level. This temporary pullback would allow the market to consolidate recent gains before potentially resuming the upward trend.
On-chain Analysis
By Shayan
As Bitcoin’s value continues its ascent towards the $66K mark, a deeper dive into the Binance liquidation heatmap unveils the underlying factors that influence the market’s behavior. The heatmap showcases critical liquidity zones that impact price action.
The $50,000 level stands as a vital support area, supported by substantial liquidity beneath this threshold. This liquidity represents stop-loss orders and liquidation points, mainly from larger market participants, including whales. In contrast, the $66K-$70K range emerges as another significant liquidity pool, containing a notable concentration of liquidity that corresponds to larger sell orders, stop-loss triggers, and potential liquidation levels.
Currently, Bitcoin’s price is nestled between two prominent liquidity zones. On one side, the $50K level is fiercely defended by whales and significant market players, thwarting further declines.
On the other hand, the $66K-$70K resistance presents a critical barrier due to the liquidity concentration. Broadly speaking, Bitcoin finds itself caught between these two pivotal levels, and a breakout from either side could initiate a liquidation cascade that enhances the current trend.

The post Bitcoin Price Analysis: BTC Tumbles to $64K as Bears Look to Reappear appeared first on CryptoPotato.


 Dutch
Dutch English
 French
 German
 Greek
Greek Italian
 Portuguese
 Russian
 Spanish