


The price of Chainlink (LINK) is drawing interest as it nears critical resistance levels, with various technical indicators pointing towards possible movements ahead.
After a recent uptick, LINK’s momentum might facilitate further increases, but traders are vigilant regarding vital thresholds.
LINK Directional Movement Index Appears Optimistic
The Directional Movement Index (DMI) for LINK is currently exhibiting robust bullish momentum. The Positive Directional Index (+DI) stands at 29.2, considerably exceeding the Negative Directional Index (-DI) at 13.3. This suggests that buyers hold a marked edge over sellers. The Average Directional Index (ADX), which gauges trend strength, is at 28.2, implying that the existing trend is resilient.
The DMI consists of three primary indicators: +DI, -DI, and ADX. While +DI and -DI monitor the intensity of upward and downward price shifts, the ADX assesses overall trend strength. Generally, an ADX above 25 signals a powerful trend, whereas lower values indicate weaker trends or consolidation. When +DI surpasses -DI, it reflects bullish momentum; conversely, the opposite indicates bearish sentiment.
Learn more: How to Purchase Chainlink (LINK) Using a Credit Card: A Comprehensive Guide
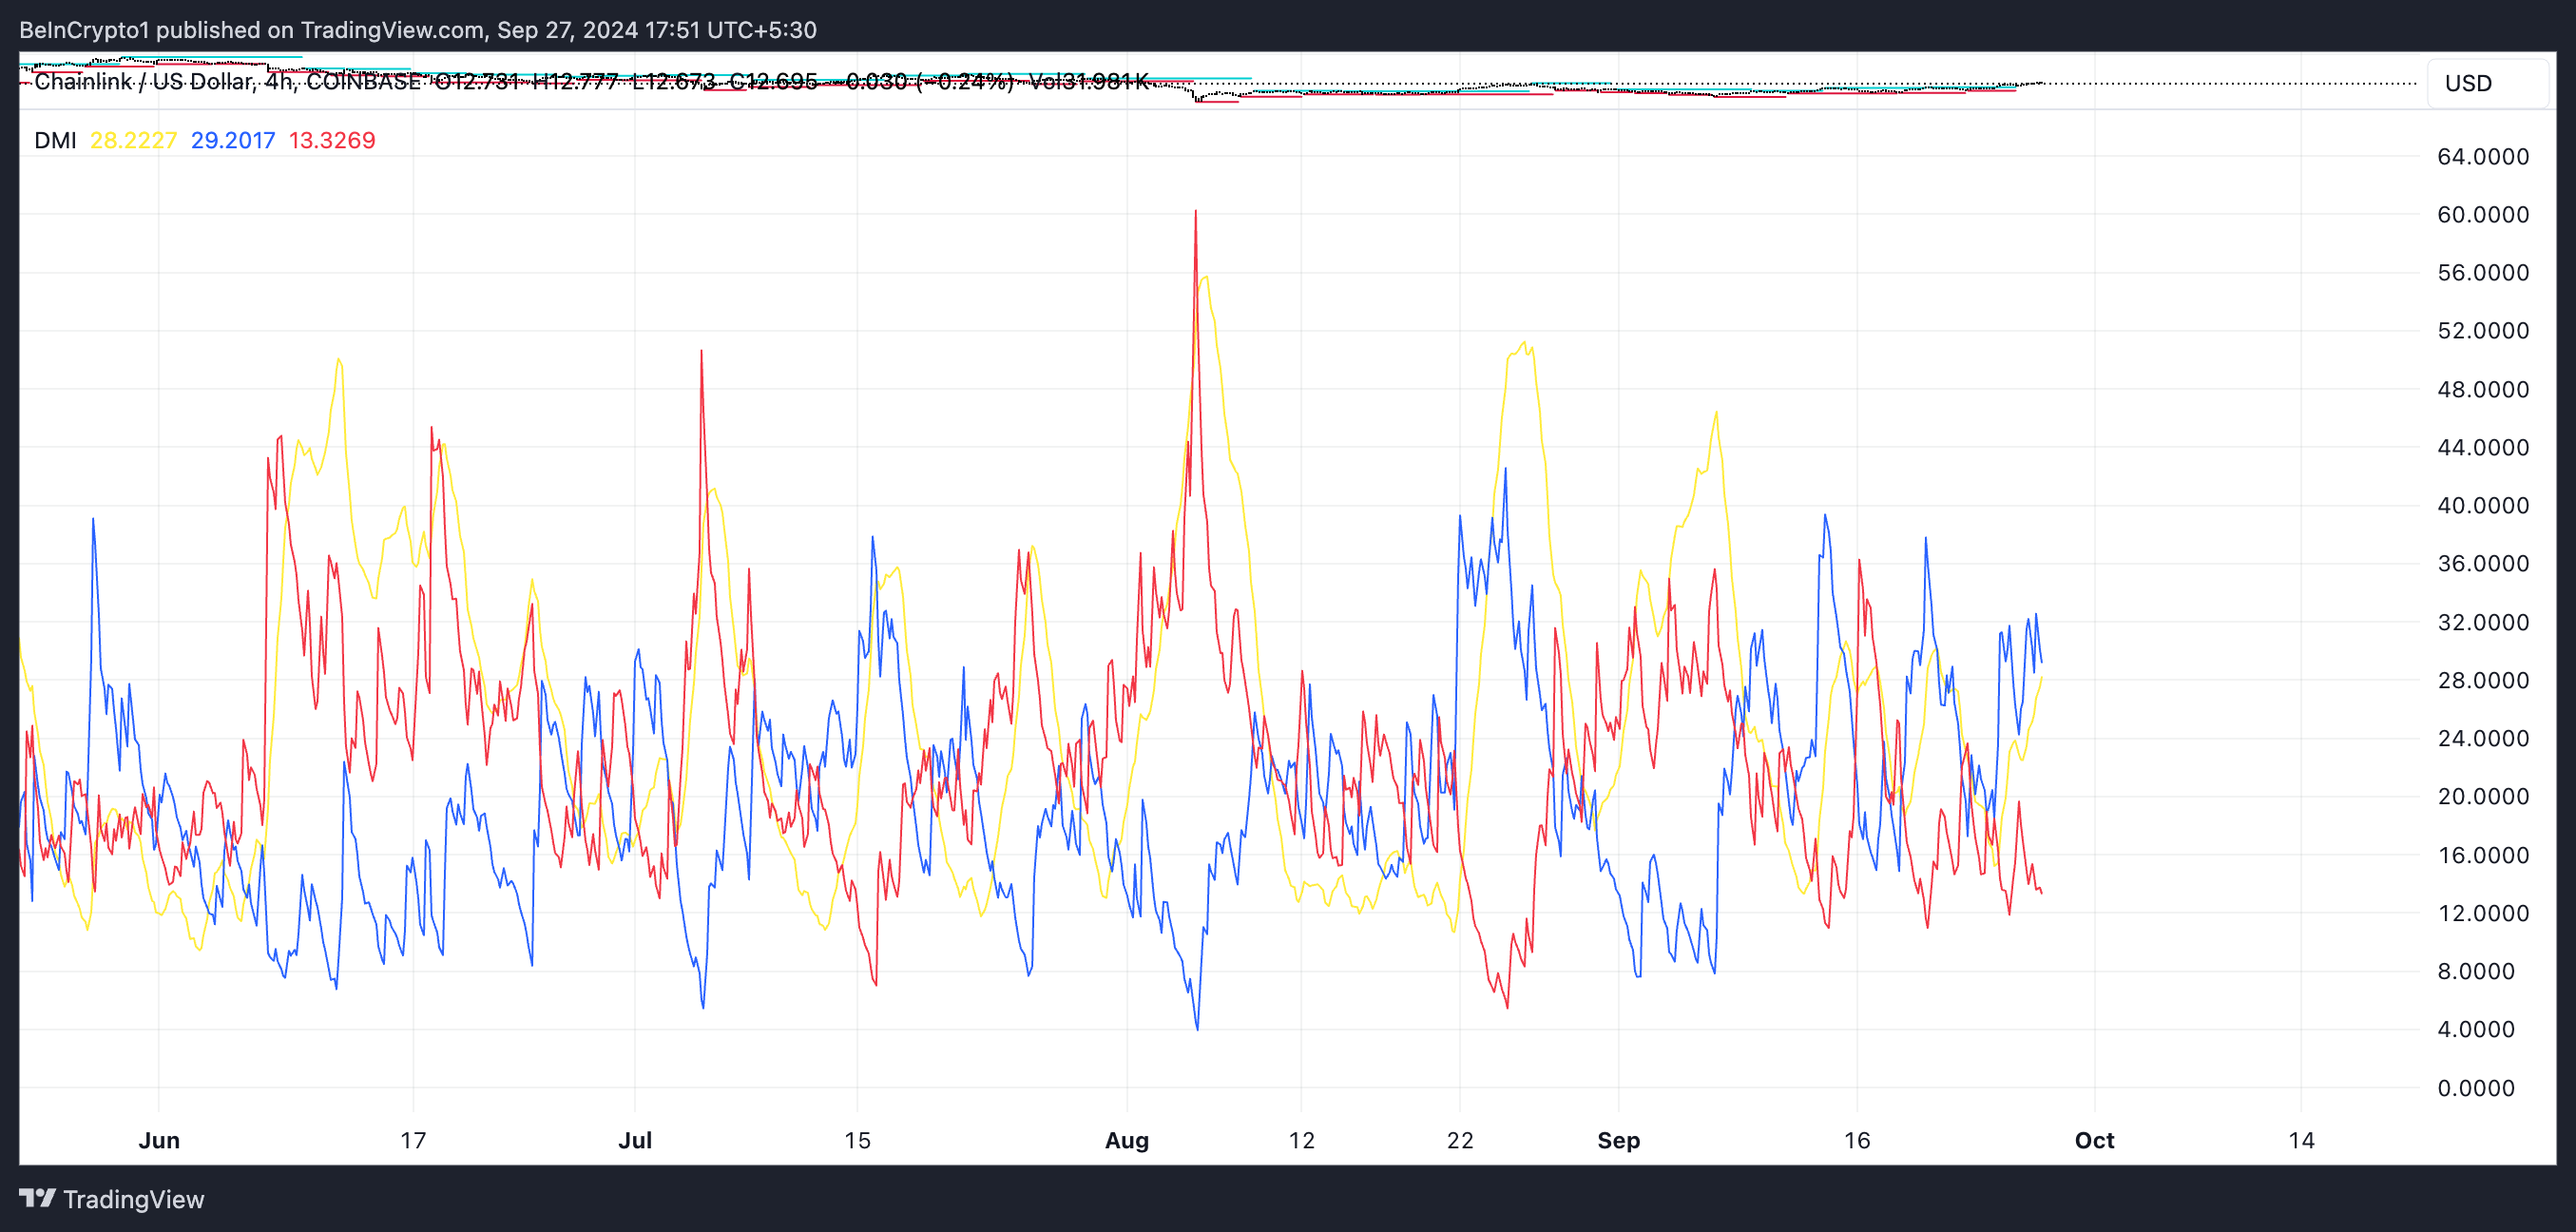
With +DI significantly above -DI and the ADX exceeding 25, LINK is experiencing a vigorous upward trend. This indicates that its value may continue to rise in the short term as buyer dominance prevails. Nonetheless, traders should remain vigilant for any changes in trend strength indicated by the ADX, as well as the interplay between the +DI and -DI lines, which could herald potential reversals.
Chainlink’s 7-Day MVRV Indicates Promise, Yet Requires Vigilance
The current 7-day MVRV Ratio for LINK is 7.9%, signaling that there may still be potential for price appreciation. The MVRV (Market Value to Realized Value) ratio assesses potential profitability for holders by comparing the present market value to the average purchase price of their holdings.
Typically, a high MVRV ratio indicates that holders are in a position of increased unrealized profit, potentially leading to greater selling pressure and price adjustments. In contrast, a low MVRV ratio implies fewer holders are realizing profits, decreasing the chance of significant sell-offs.
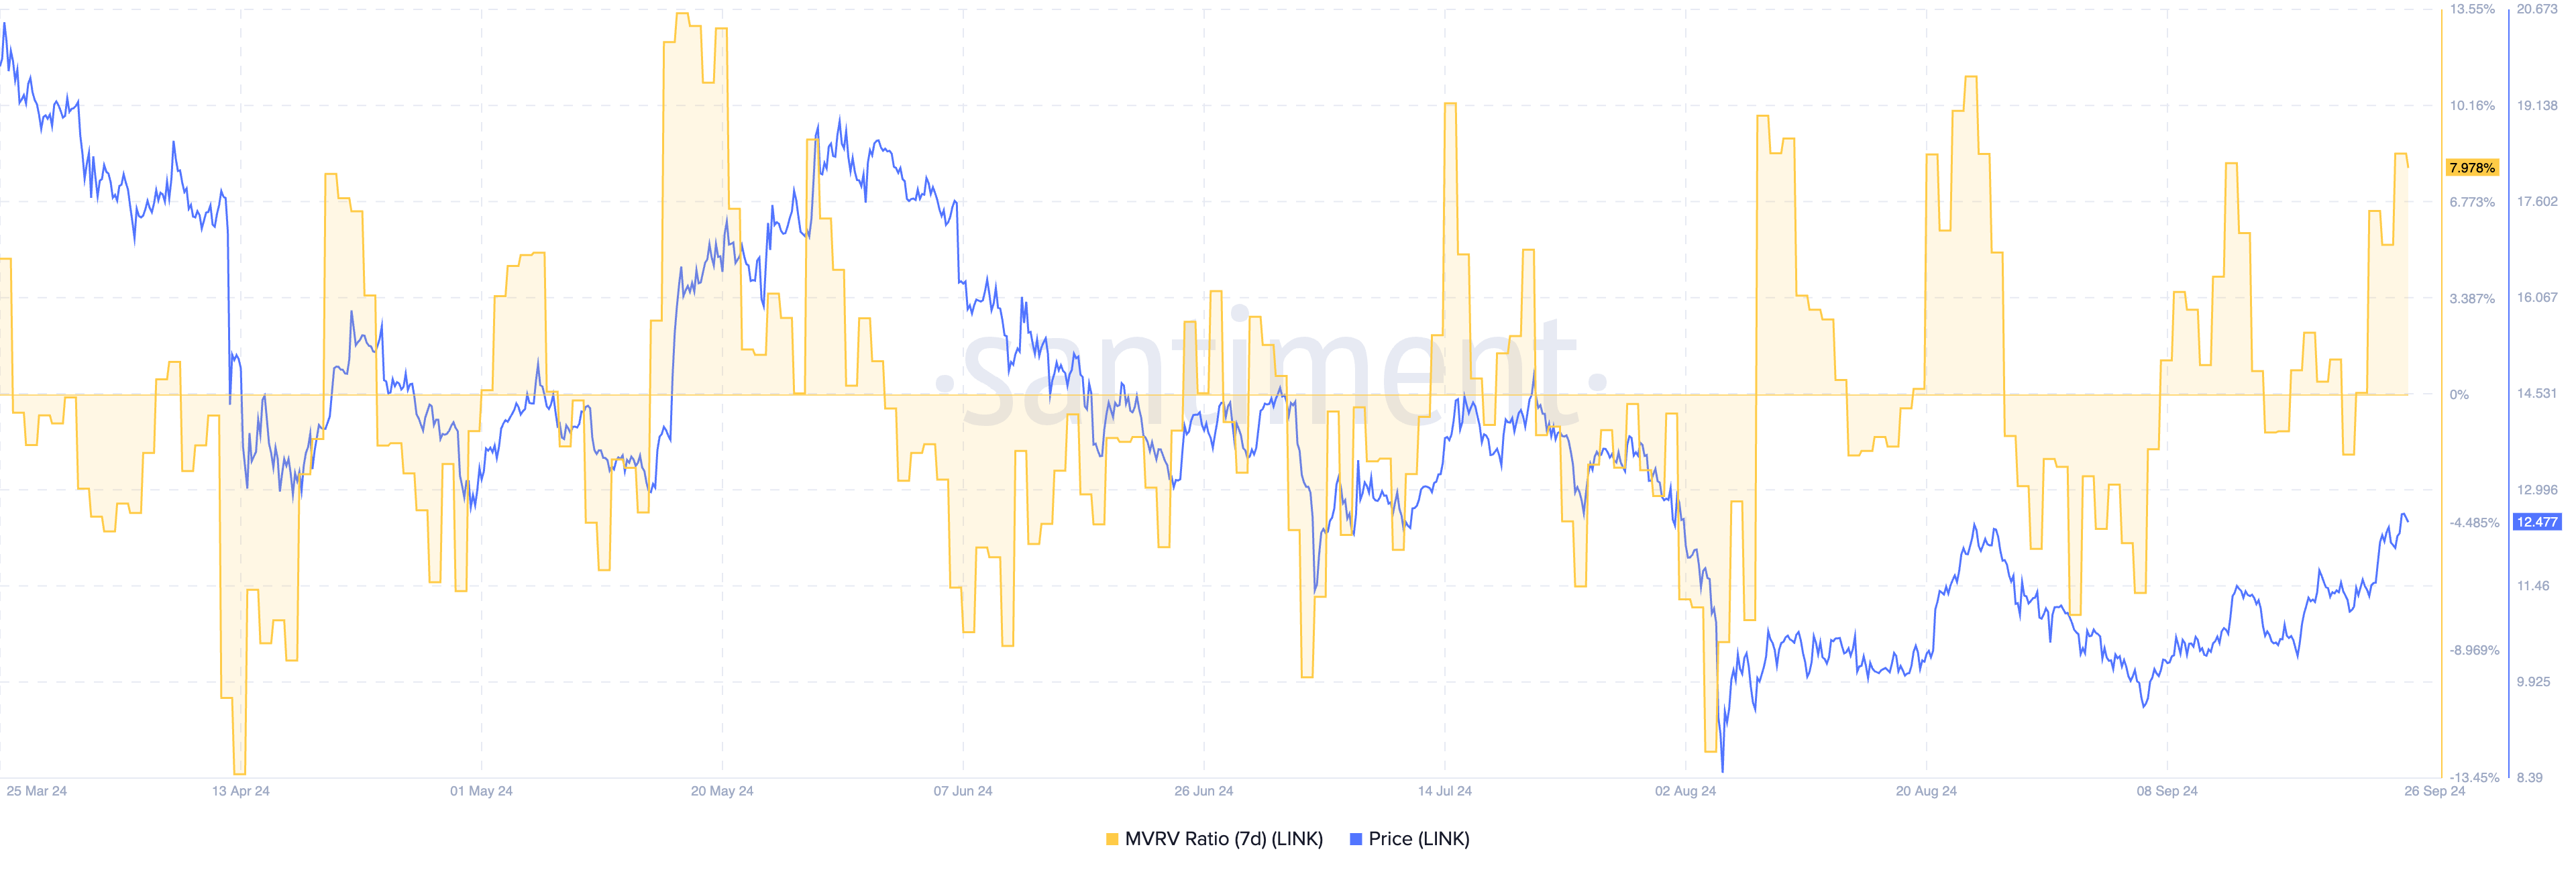
While MVRV thresholds can differ historically, a value around 10% has frequently indicated overvaluation and potential corrections. Specifically for LINK, the price has remained steady over the last six months as the MVRV approached 10%. However, upon reaching this level, LINK experienced price corrections as traders likely took profits at these elevated figures.
With the MVRV currently at 7.9%, LINK seems to have some capacity for further price increases. However, as this ratio nears the 10% mark, it becomes vital to observe this metric closely. An increase beyond that could signal a higher risk of a pullback, as more holders may enter into profit territory and consider selling.
LINK Price Forecast: 50% Upsurge Anticipated
On September 17, the EMA (Exponential Moving Average) lines for LINK formed a golden cross, triggering a significant price spike of 20% in the subsequent days. A golden cross occurs when a short-term EMA moves above a long-term EMA, often signaling a shift towards bullish momentum. Traders typically monitor this pattern as a precursor to upward price activity.
The EMAs provide a smoothed view of price data to help identify trends, with a golden cross generally perceived as a bullish indicator, especially when the shorter EMA crosses over the longer one.
Learn more: Chainlink (LINK) Price Predictions for 2024/2025/2030
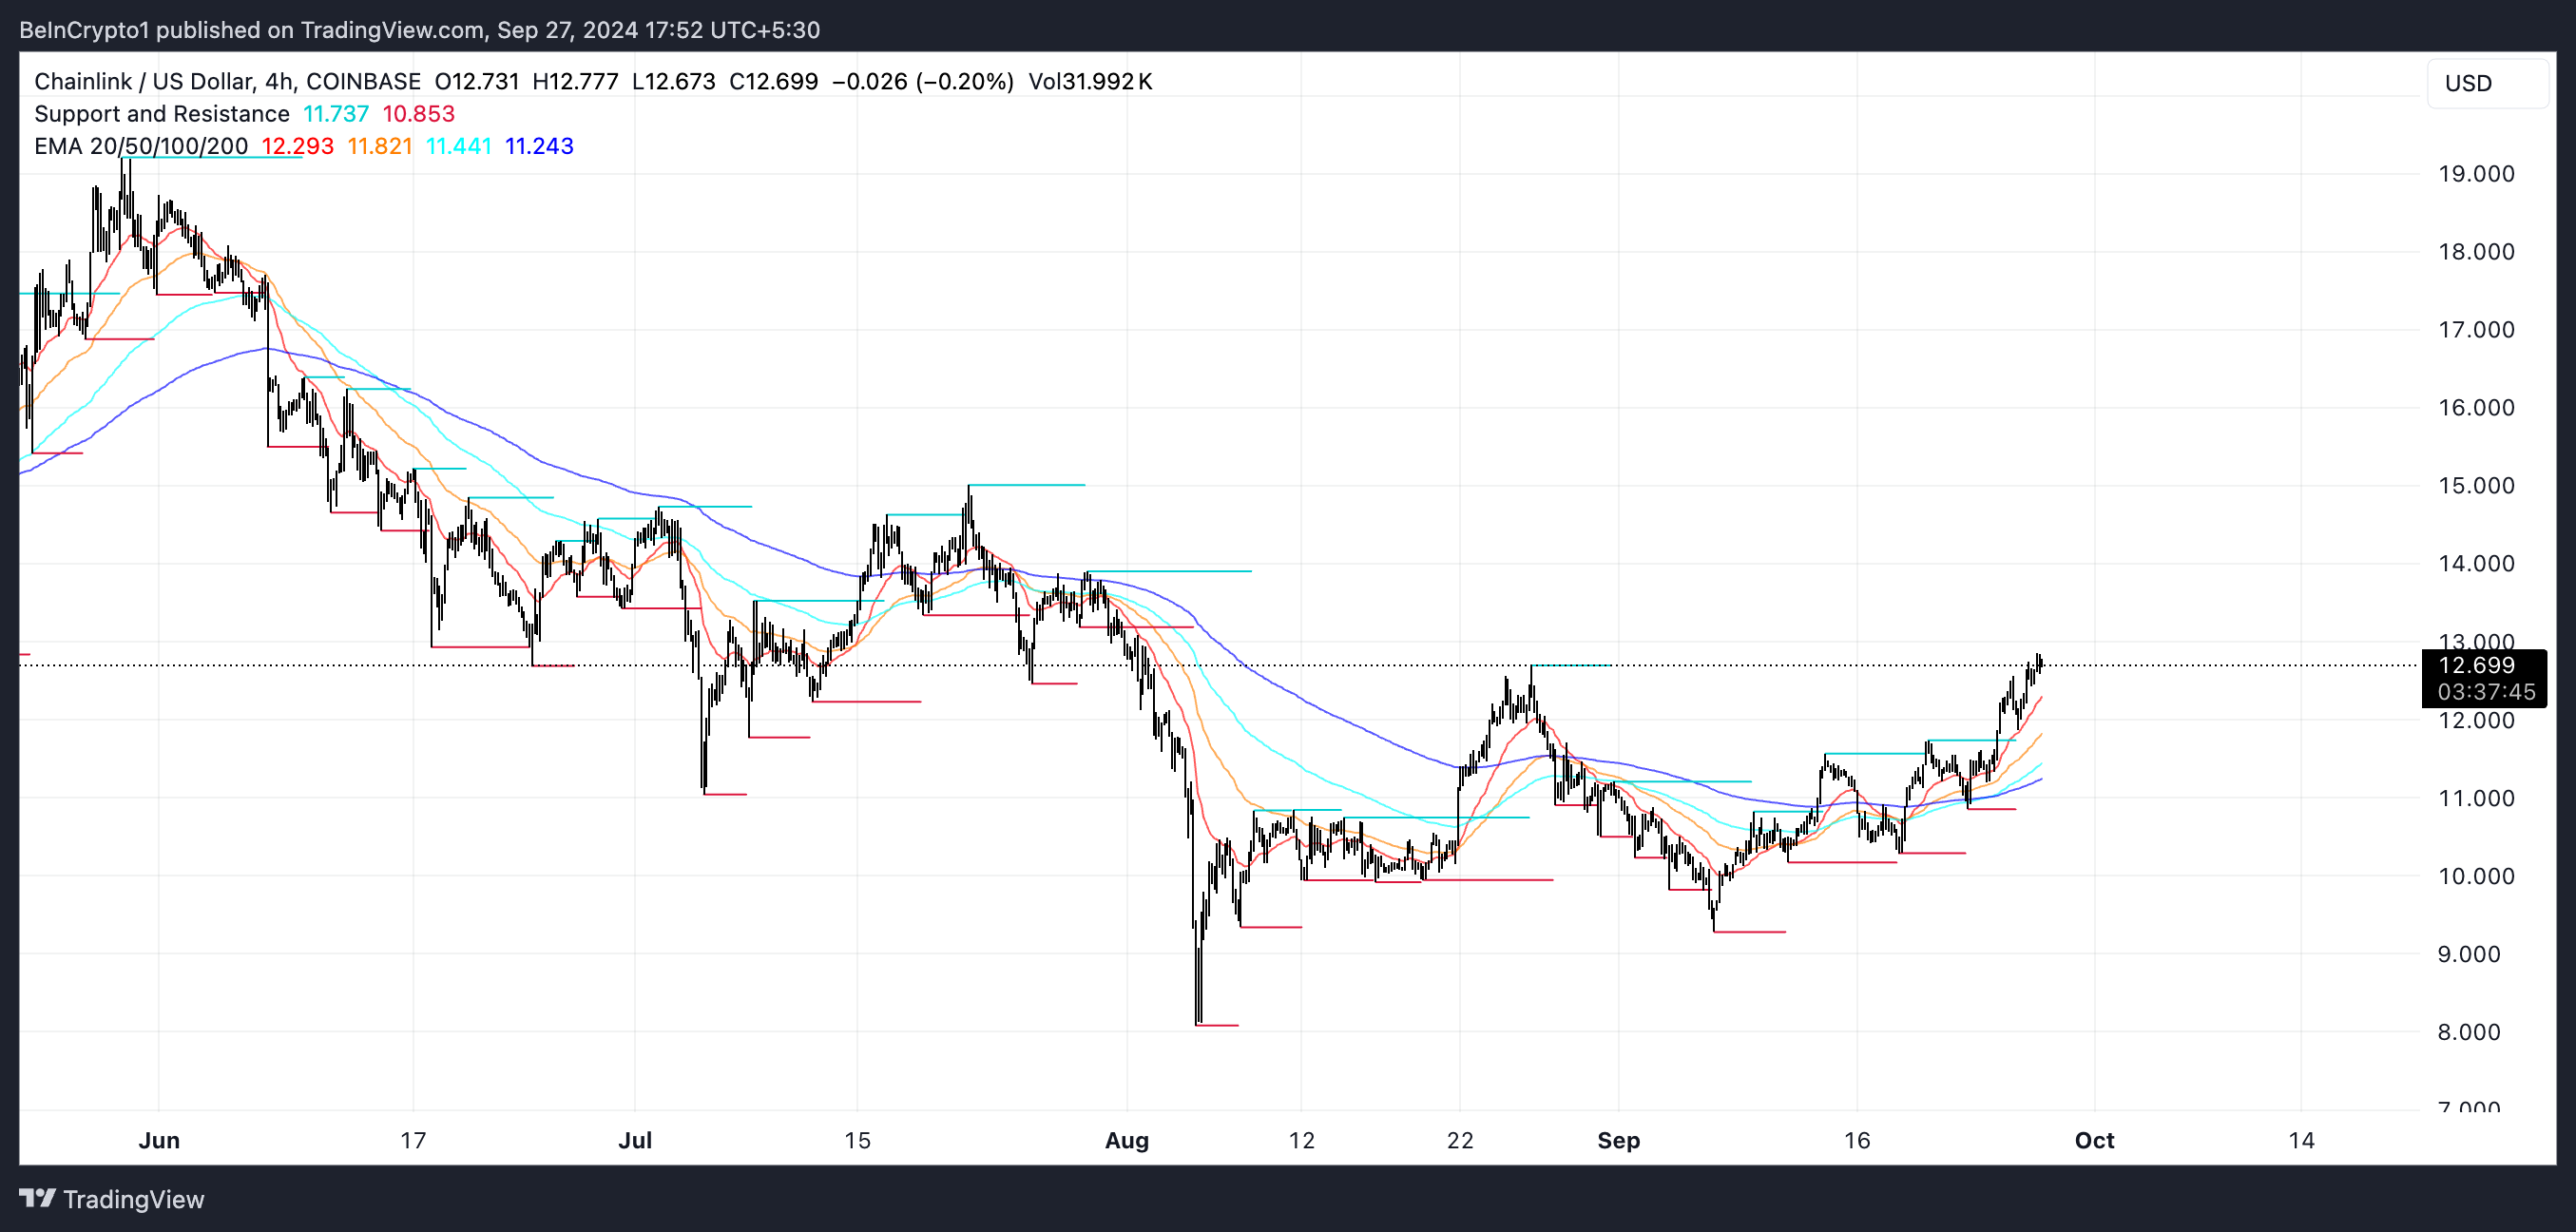
Although the EMA lines are in a bullish configuration, they are not significantly distanced apart, which may cause some traders to be cautious. The closer alignment of the lines can indicate that while the trend is bullish, it may not be fully established or could face volatility.
Chainlink is currently encountering substantial resistance at critical levels of $13.9 and $15. Should LINK successfully surpass these resistance points, it could aim for the $19.1 level, signifying a potential 50% increase from its current value.
Conversely, if the trend reverses and the EMAs cross again, LINK could see a pullback, possibly dropping back to $9.9, which is an essential support level. Traders should keep a close watch on these levels, as they are integral in determining LINK’s forthcoming trajectory.
Disclaimer
This price analysis article is intended for informational purposes only and should not be taken as financial or investment advice, in accordance with Trust Project guidelines. BeInCrypto strives for accuracy and impartiality in its reporting, but market conditions can shift without notice. Always conduct your own investigation and consult with a professional before making any financial choices. Please be aware that our Terms and Conditions, Privacy Policy, and Disclaimers have been updated.


 Dutch
Dutch English
 French
 German
 Greek
Greek Italian
 Portuguese
 Russian
 Spanish