


The price of BONK has been experiencing intense volatility recently, attracting the attention of traders due to its rapid changes. With momentum indicators showing significant signals, the upcoming movement could be crucial for those invested in or observing the token.
Key technical signals indicate that BONK may break through new resistance levels or encounter a possible correction.
BONK RSI Is Currently Overbought
The Relative Strength Index (RSI) for BONK has surged to 81.25 following a 22% increase in price over the past week, representing a notable shift from just three days prior when the RSI stood at 30. This swift increase is important as it signifies a sharp change in market sentiment, transitioning from an oversold to an overbought state in a brief period.
The RSI is a commonly used momentum indicator that assesses the speed and extent of price changes to reveal overbought or oversold conditions. Generally, an RSI reading above 70 suggests that an asset is overbought and may be due for a correction, while a reading below 30 points to an oversold situation and the potential for a rebound.
With BONK’s RSI at 81.25 and its moving average nearing 69, this indicates that the asset may be entering an overheated territory where selling pressure might begin to emerge.
Read More: How to Purchase Solana Meme Coins: A Step-By-Step Guide
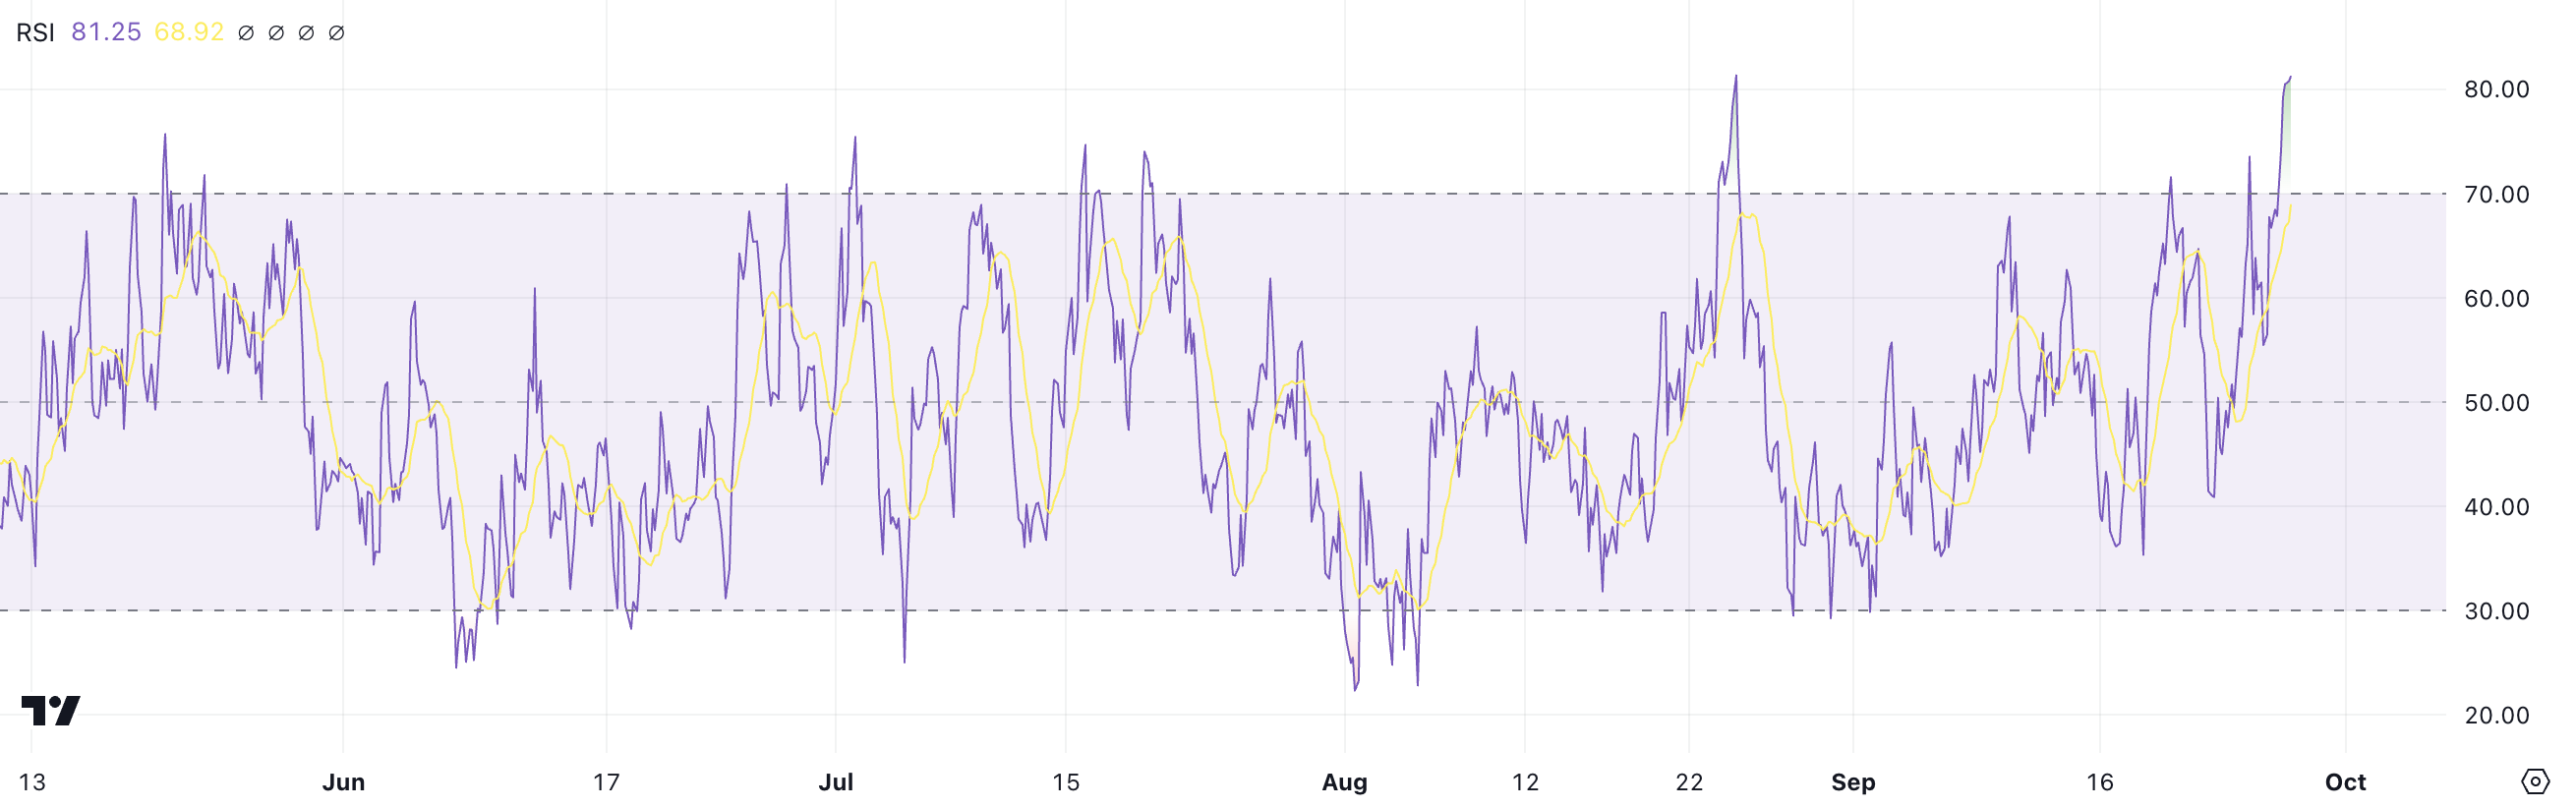
While the strong bullish momentum might drive the price higher in the short term, such elevated RSI readings often suggest that a reversal or price consolidation could be on the horizon, as buyers may begin locking in profits. Thus, traders should be wary of a possible pullback while keeping an eye on the broader market sentiment.
BONK Buying Pressure: A Pivotal Moment Approaching
The Chaikin Money Flow (CMF) for BONK has fallen to 0.03, down from nearly 0.30 in previous weeks, indicating a notable decrease in buying pressure. This decline is significant since the CMF is a volume-weighted indicator that assesses the movement of money into and out of an asset, offering insights into the strength of buying or selling pressure.
Generally, a CMF reading above 0.20 demonstrates strong buying momentum, whereas values below -0.20 denote considerable selling pressure. Despite being a prominent meme coin within the Solana ecosystem, BONK still lags behind WIF (dogwifhat) in terms of market capitalization and year-to-date performance. This might generate selling pressure on BONK as traders redirect their investments toward other Solana assets with potentially higher returns.
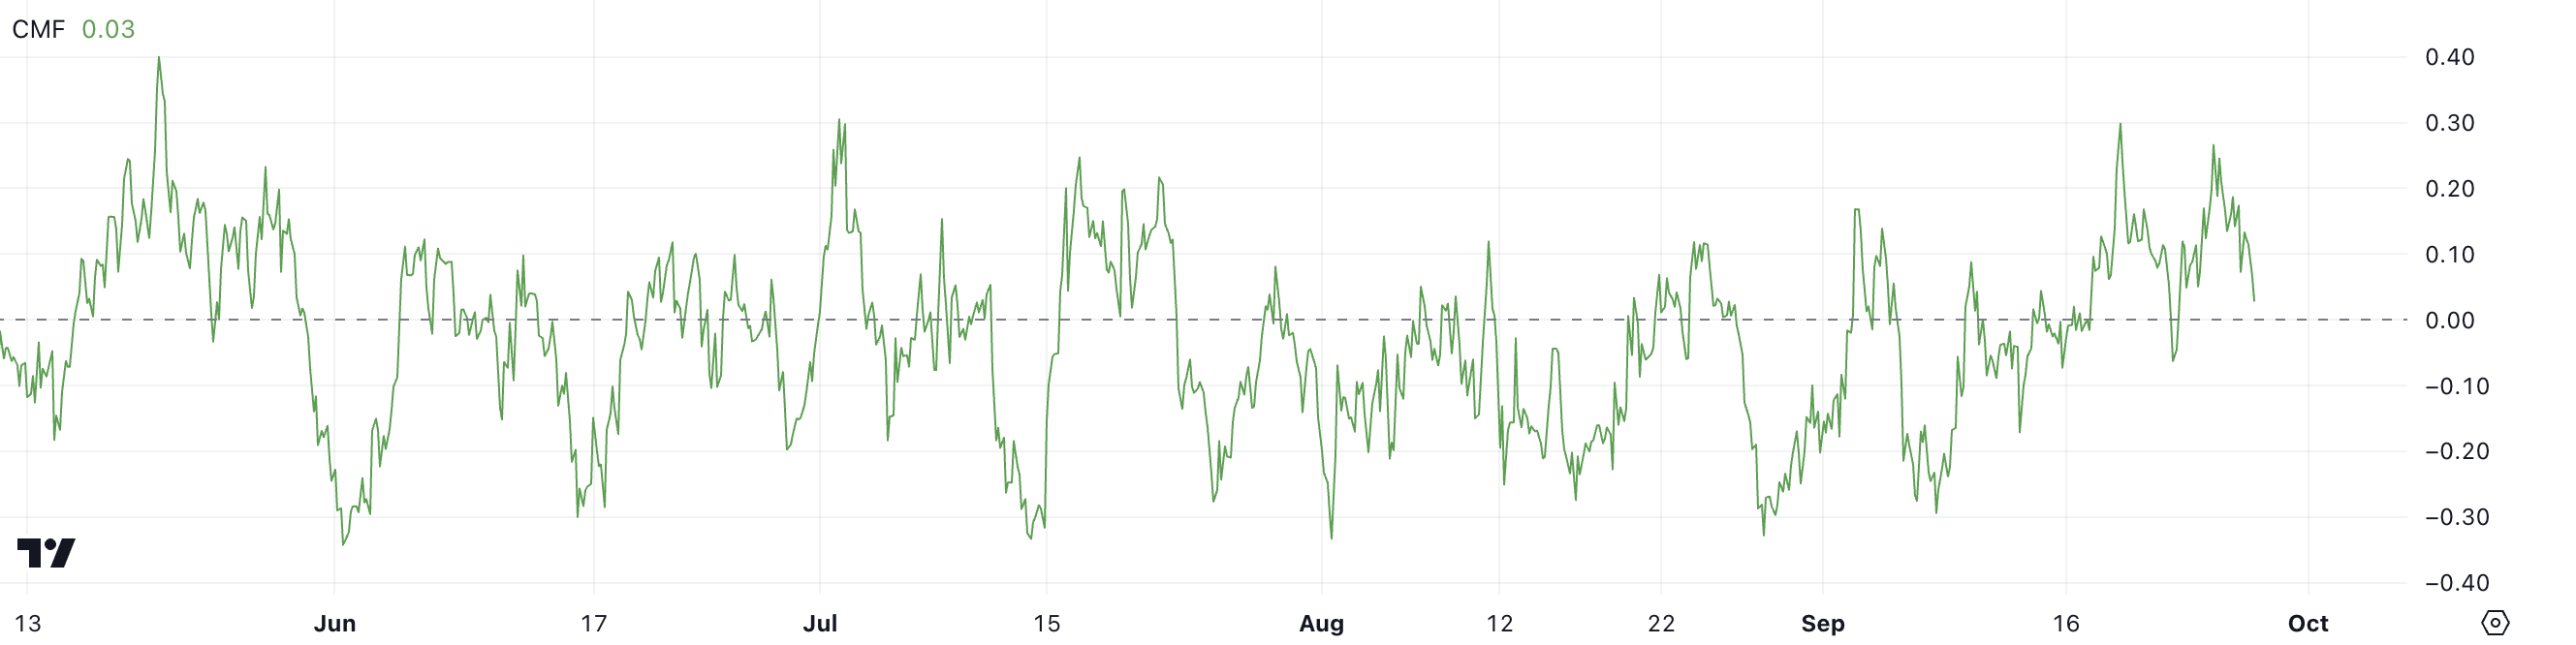
As the CMF approaches zero, market sentiment becomes increasingly neutral, indicating a balance between buyers and sellers. With BONK’s CMF currently at 0.03, it demonstrates that while there is still some buying interest, it has substantially weakened, suggesting that the recent price rally may be losing momentum.
BONK Price Forecast: Will The Trend Persist?
Just three days ago, BONK’s Exponential Moving Averages (EMA) established a golden cross—a bullish sign where the short-term moving average surpasses the long-term moving average—resulting in a 27% price rise. However, it is noteworthy that the lines are not yet significantly distanced from each other, which is crucial as this indicates that the bullish trend is still developing and lacks robust momentum.
EMA lines are technical tools that highlight recent price actions, assisting traders in identifying trends and possible reversals. When these lines intersect, they can signify changes in market sentiment, with a golden cross typically indicating the beginning of an upward trend.
Read More: 11 Essential Solana Meme Coins To Monitor in September 2024
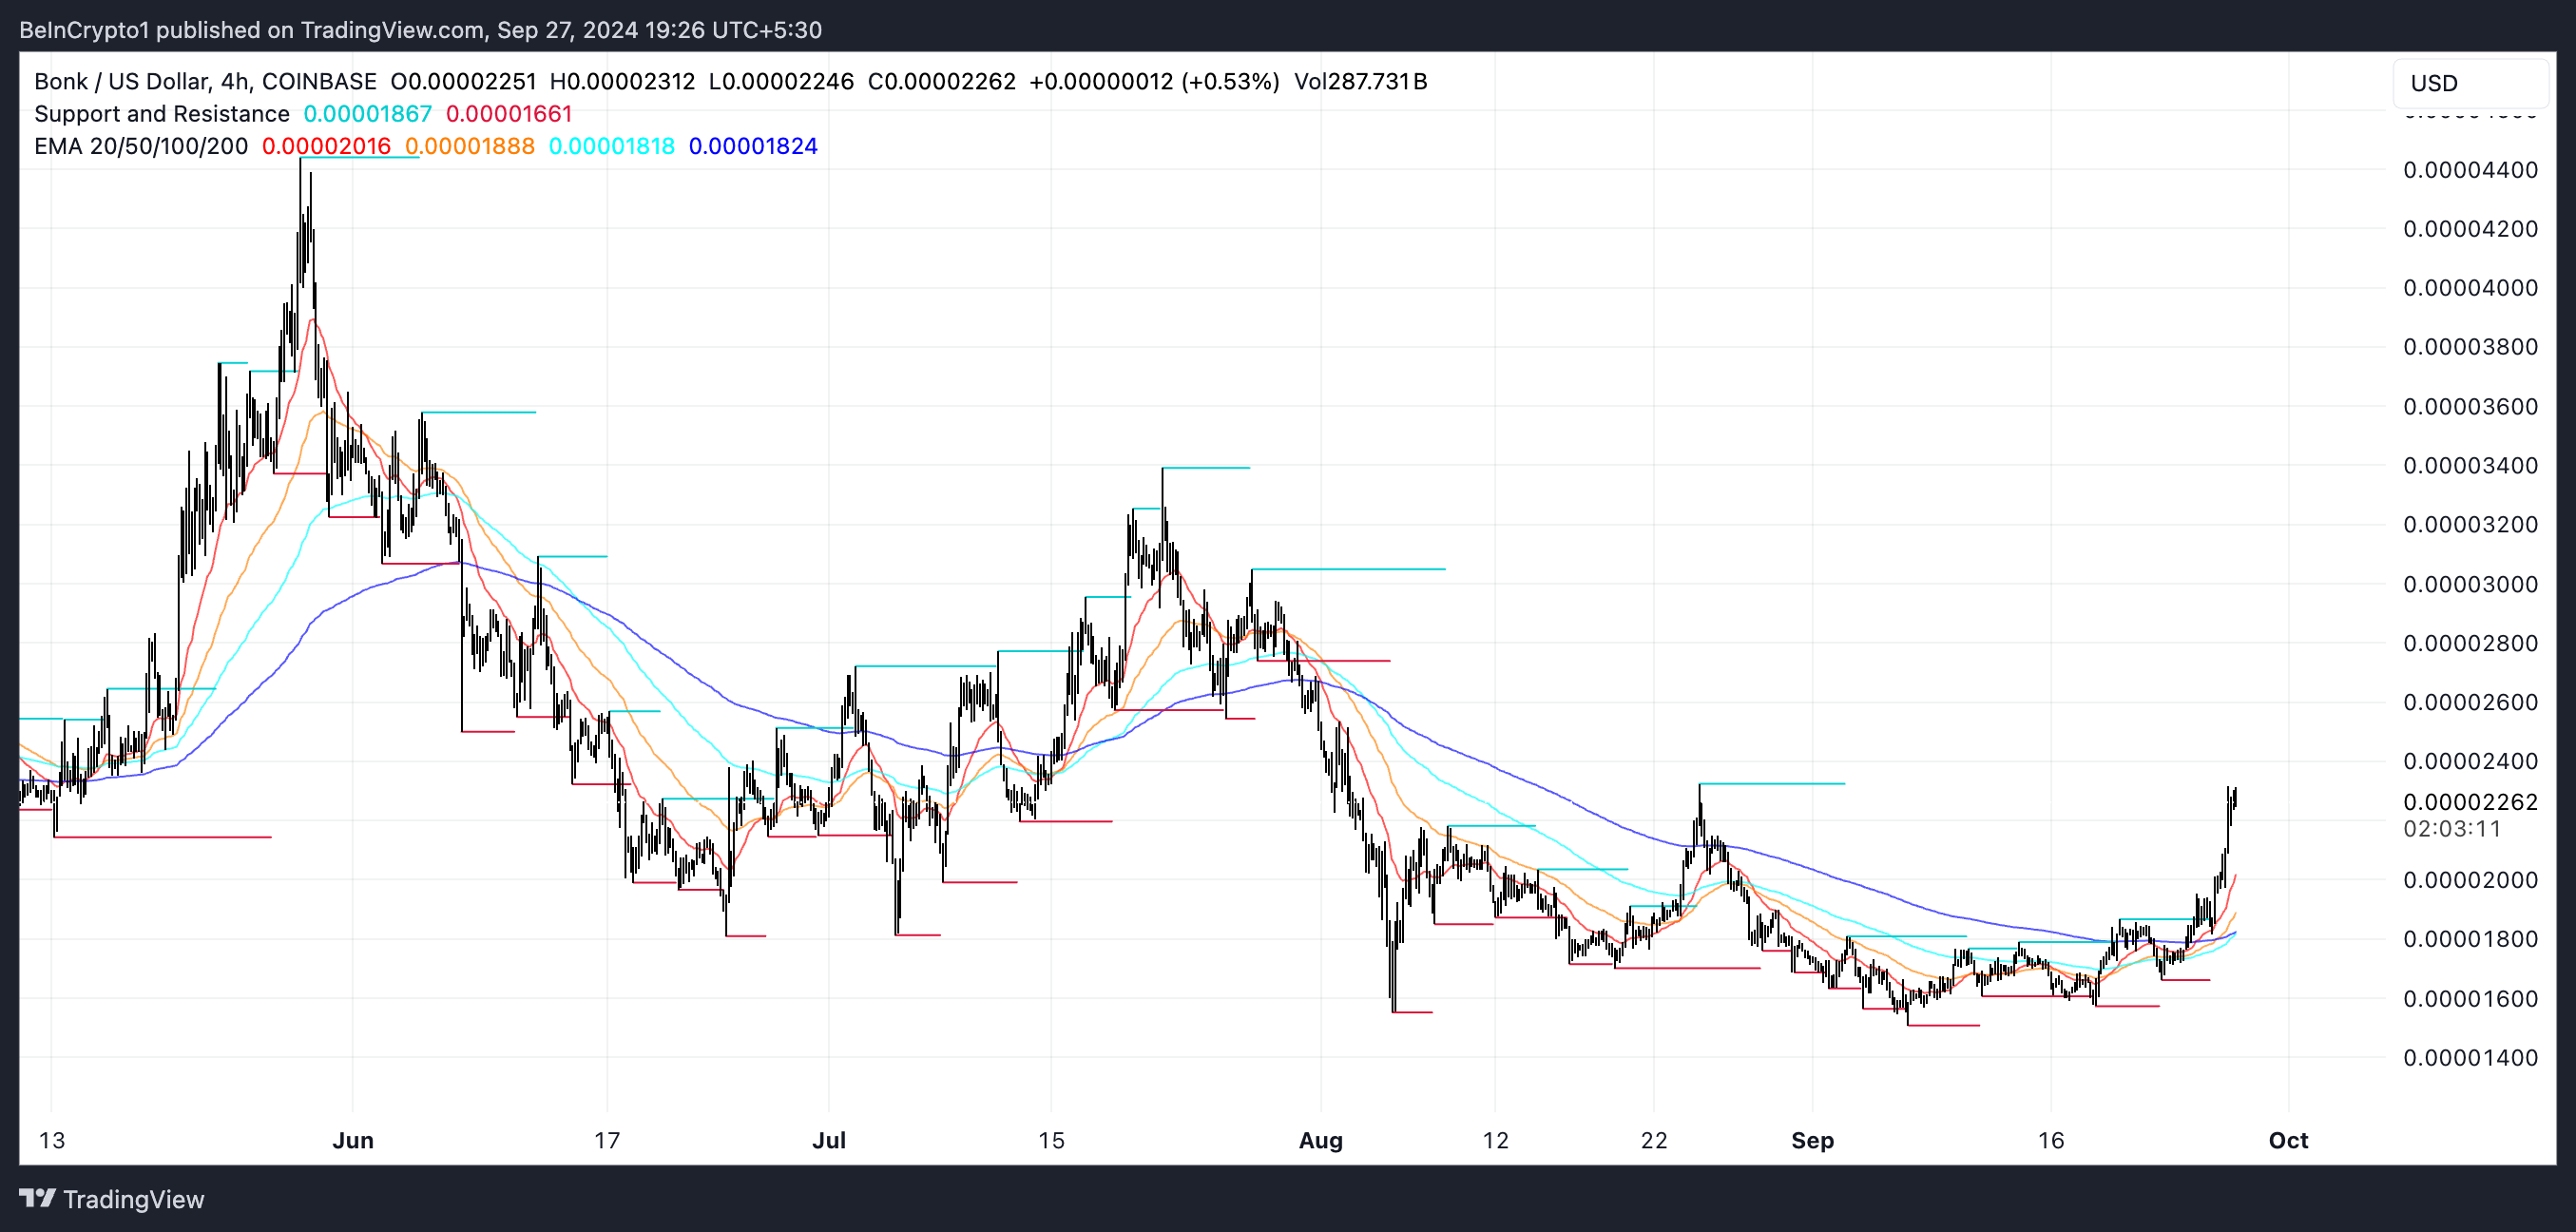
If the current trend persists, BONK’s price could potentially surpass key resistance levels at $0.30, $0.35, and even $0.44, representing a potential 82% increase. However, both the CMF and RSI are indicating that these gains may be nearing their limit. With the CMF declining and the RSI in an overbought state, there exists a strong likelihood of a trend reversal.
Should this occur, BONK may quickly drop to $0.16, and possibly test lower levels such as $0.13 or $0.12, as traders start to realize profits and selling pressure escalates. This creates a crucial juncture for BONK, where either a continuation or correction seems likely in the near future.
Disclaimer
In accordance with the Trust Project guidelines, this price analysis piece is intended for informational purposes solely and should not be interpreted as financial or investment advice. BeInCrypto is dedicated to precise, impartial reporting, yet market conditions can change without warning. Always perform your own research and consult with a professional before making any financial choices. Please be aware that our Terms and Conditions, Privacy Policy, and Disclaimers have been updated.


 Dutch
Dutch English
 French
 German
 Greek
Greek Italian
 Portuguese
 Russian
 Spanish