


The bullish momentum for BNB has encountered a significant obstacle as the $600 resistance level stands firm. Following a noteworthy ascent, the momentum has slackened, leading to a build-up of downward pressure. While bulls find it challenging to reclaim dominance, bears are gaining traction, indicating a possible change in market sentiment. With the rally stalling and pivotal support levels at risk, BNB is now confronting an amplified threat of a pullback, leaving traders anxious as the price lingers at this vital juncture.
As BNB confronts the strong $600 resistance, we aim to delve into the intensifying pressure that has stalled its recent uptrend. We will analyze the technical indicators hinting at a potential decline, market sentiment, and prospective price movements as bulls strive to regain their footing.
Risk Assessment: Analyzing The Downside Risk
Even though BNB’s price is trading above the 100-day Simple Moving Average (SMA) on the 4-hour chart—an indicator generally suggesting a bullish trend—the cryptocurrency is facing considerable resistance at the $600 level. This barrier has triggered a distinct pullback, revealing that upward momentum is waning as sellers take advantage of the current price point.
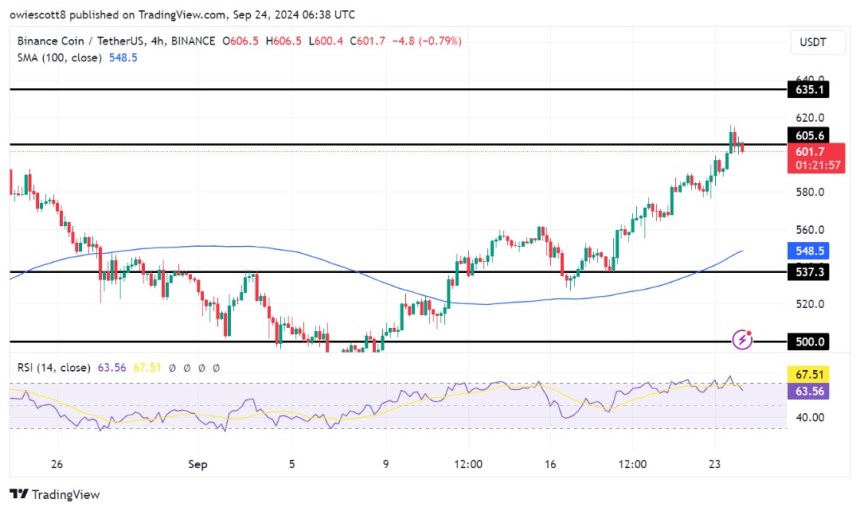
Analysis of the 4-hour Relative Strength Index (RSI) indicates a potential price decrease, as the RSI line retreats from the overbought area toward the 50% mark, suggesting increasing bearish pressure that may drive the price down to $537.
Furthermore, the daily chart reveals that BNB is currently exhibiting bearish momentum as it trends downward toward the $537 level. After exceeding the 100-day SMA, the price had maintained a steady upward trajectory without any substantial pullbacks, hinting that a significant correction could be imminent.
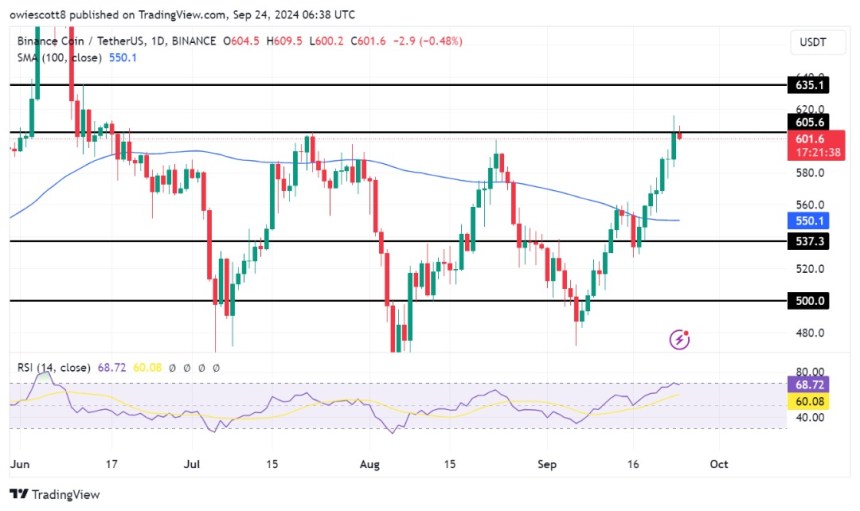
A detailed examination of the RSI signal line on the 1-day chart shows a decline to 68% after reaching a peak of 72%. This movement indicates a shift in momentum, suggesting that BNB is entering a consolidation phase or experiencing heightened selling pressure, which could lead to further price corrections.
Future Outlook: What Lies Ahead for BNB?
Despite demonstrating fortitude by remaining above essential moving averages, the rising bearish pressure and recent pullbacks imply that BNB’s price could decline toward the $537 support level. Should it breach this threshold, it may prompt a further decline toward additional support levels, raising apprehensions among traders about a potential extended downward trend.
Conversely, if the bulls manage to mount a recovery before BNB approaches the $537 support level, the price could begin to ascend again toward the $600 resistance. A breakout beyond this crucial barrier may pave the way for further gains, enabling BNB to test higher resistance levels as bullish momentum accelerates.


 Dutch
Dutch English
 French
 German
 Greek
Greek Italian
 Portuguese
 Russian
 Spanish