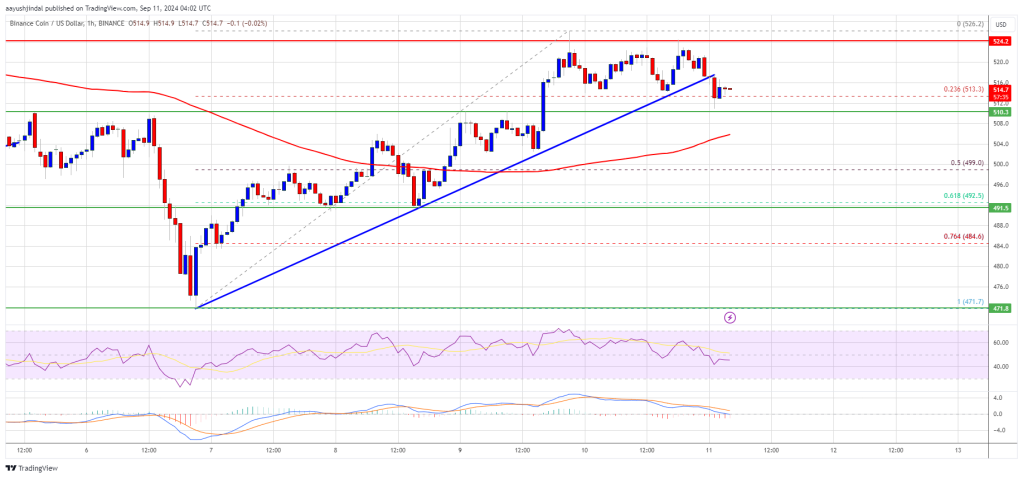
The price of BNB has embarked on a new upward trend, surpassing the $500 pivot zone. Currently, the price is consolidating its gains and may target further increases above $525.
- BNB price initiated a new increase past the $500 resistance level.
- The price is presently trading under $510 and below the 100-hourly simple moving average.
- A notable break occurred below a significant bullish trend line with support at $517 on the hourly chart for the BNB/USD pair (data sourced from Binance).
- The pair must remain above the $500 pivot point to facilitate another potential increase in the near future.
BNB Price Stabilizes Above $500
Following the establishment of a base above the $470 mark, BNB price embarked on a fresh upward movement, mirroring trends observed in Ethereum and Bitcoin. The price successfully broke through the $488 and $500 resistance levels.
It also surpassed the $515 level, making a test at $525. A high of $526 was recorded before the price entered a corrective phase. It dropped below the $520 mark and slipped just beneath the 23.6% Fib retracement level of the upward trajectory from the swing low of $471 to the high of $526.
Moreover, a breakdown below a significant bullish trend line with support at $517 was noted on the hourly chart of the BNB/USD pair. Currently, the pair is trading above $510 and below the 100-hourly simple moving average.
If a renewed increase occurs, the price might encounter resistance around the $518 mark. The next level of resistance is found near $525. A decisive move above the $525 area could propel the price higher, potentially reaching $535.

A closing price above the $535 resistance could pave the way for a significant move towards the $550 resistance. Further gains might necessitate a test of the $562 level in the upcoming period.
Is Another Decline Possible?
Should BNB be unable to surpass the $525 resistance, it may initiate another downward movement. The initial support on the downside is around the $510 mark. The next crucial support level is near $500.
The primary support is located at $492. If the price declines below the $492 support, it could fall towards the $470 support. Additional losses could trigger a more substantial decline toward the $450 level.
Technical Indicators
Hourly MACD – The MACD for BNB/USD is showing a decrease in momentum within the bullish territory.
Hourly RSI (Relative Strength Index) – The RSI for BNB/USD is currently above the 50 threshold.
Major Support Levels – $510 and $500.
Major Resistance Levels – $518 and $525.


