


The price of Bitcoin has begun a new decline, falling below the $65,000 mark. BTC is currently testing the support zone at $62,850 and may initiate another upward movement.
- Bitcoin is undergoing a correction below the $65,500 area.
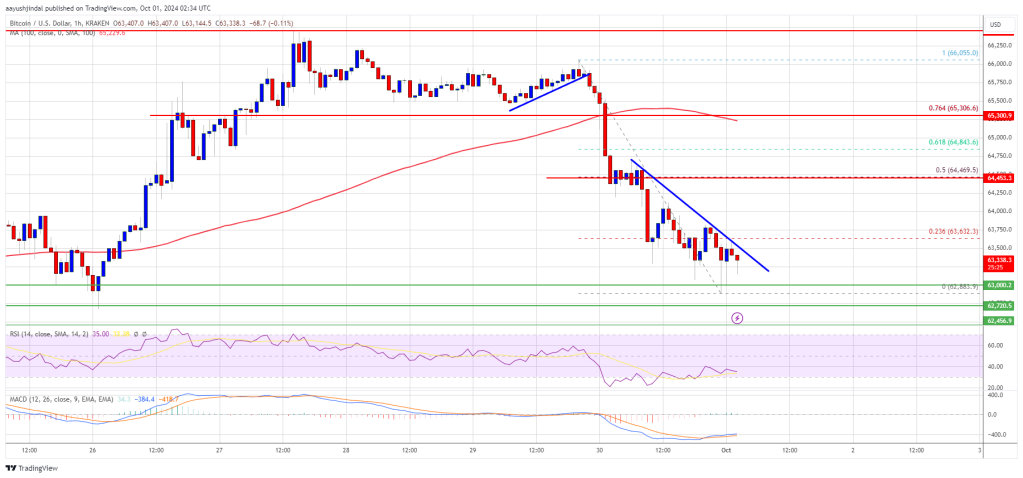
- The price remains below $65,000 and the 100 hourly Simple Moving Average.
- A bearish trend line is forming with resistance at $63,500 on the hourly chart of the BTC/USD pair (data feed from Kraken).
- The pair could potentially start another increase if it remains above the $62,500 support level.
Bitcoin Price Approaches Support
Bitcoin’s price has begun to decline from the $66,000 resistance level. BTC dropped below the $65,000 and $64,500 support levels, entering a short-term bearish phase.
The price even went below $63,500, reaching a low of $62,883, and is currently consolidating its losses. It is also trading below the 23.6% Fib retracement level of the downward movement from the $66,055 swing high to the $62,833 low.
Bitcoin is trading beneath $64,500 and the 100 hourly Simple Moving Average. Should there be another increase, the price may encounter resistance around the $63,500 mark. Additionally, there exists a bearish trend line with resistance at $63,500 on the hourly chart of the BTC/USD pair.
The principal resistance is around the $64,500 level, which is near the 50% Fib retracement level of the decline from the $66,055 swing high to the $62,833 low.
A decisive move above the $64,500 resistance could drive the price higher. The next significant resistance may be at $65,500. If the price closes above $65,500, it could lead to further upward momentum. In this scenario, the price might rise and challenge the $66,200 resistance level, with additional gains potentially pushing it towards the $68,000 resistance level.
Further Declines for BTC?
If Bitcoin does not break above the $63,500 resistance area, it may continue to drop. The immediate support on the downside is around the $63,000 level.
The first major support is at approximately $62,850, followed by support near the $62,500 zone. Any further declines could push the price down towards the $61,200 support in the near future.
Technical indicators:
Hourly MACD – The MACD is currently gaining traction in the bearish territory.
Hourly RSI (Relative Strength Index) – The RSI for BTC/USD is below the 50 level at this time.
Major Support Levels – $62,850, followed by $62,500.
Major Resistance Levels – $63,500 and $64,500.


 Dutch
Dutch English
 French
 German
 Greek
Greek Italian
 Portuguese
 Russian
 Spanish