


Bitcoin has seen a remarkable rise of 11% in its price since Tuesday, following the Federal Reserve’s announcement regarding a 50 bps interest rate reduction. This development has enhanced investor confidence, allowing BTC to surpass the $60,000 threshold—an essential psychological milestone that has altered market sentiment. Currently, BTC is evaluating local supply levels, with analysts closely observing forthcoming developments.
As the market ascends, pivotal data indicates that Bitcoin’s liquidity is predominantly above the $65,000 level, with a significant zone around the $70,000 mark. This area is increasingly becoming the focal point for traders and investors eager to validate the onset of a more vigorous uptrend. A breach past these supply levels could suggest continued momentum for BTC, indicating the prospect of reaching new all-time highs.
With the market trending upwards, investors are anticipating a decisive close above these vital price levels to affirm the bullish trend. If realized, this could lay the groundwork for a sustained rally, bringing Bitcoin closer to its next significant targets.
Bitcoin Liquidity Concentrated Above $65,000
Bitcoin is currently navigating a crucial supply level, yet many investors anticipate that it is only a matter of days before BTC tests local highs around $65,000.
Insights from Coinglass reveal substantial liquidity concentrations just above the $65,000 mark, particularly around the $70,000 level. As per the Coinglass liquidation heatmap, billions of dollars’ worth of positions are at risk of liquidation at these strategic levels. This scenario creates a significant opportunity for traders since liquidations tend to instigate sharp price fluctuations.
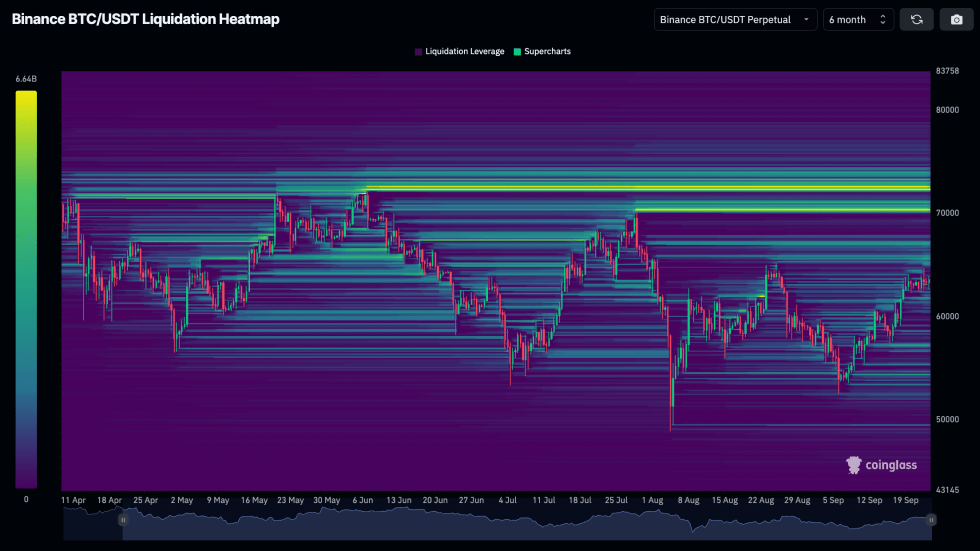
The liquidation heatmap catalogues liquidation levels based on market data and various leverage amounts. Such levels are overlaid on the price chart, assisting traders in visualizing where potential liquidations could happen.
Comprehending where these liquidation clusters exist can offer a strategic edge, akin to interpreting high liquidity zones in the order book. Traders able to foresee where major liquidations might occur can position themselves to benefit from the ensuing price volatility.
Data from Coinglass’s heatmap suggests that Bitcoin is likely to aim for these supply levels to activate liquidity. Consequently, a number of traders anticipate BTC continuing its upward trajectory, with $70,000 positioning itself as a pivotal target. Should Bitcoin reach this benchmark, it could effectively heighten bullish sentiment and propel momentum towards new all-time highs.
BTC Price Levels To Monitor
Bitcoin is currently trading at $63,641 after several days of consolidation, just under the daily 200 moving average (MA) of $63,898. This key indicator signifies long-term strength, and BTC has found it challenging to surpass this threshold.
However, Bitcoin hasn’t retraced to lower levels, suggesting that a breakout may be on the horizon. Many investors feel it is a matter of days before BTC reclaims the 200 MA and reaches the $65,000 mark, potentially fueling further upward momentum.
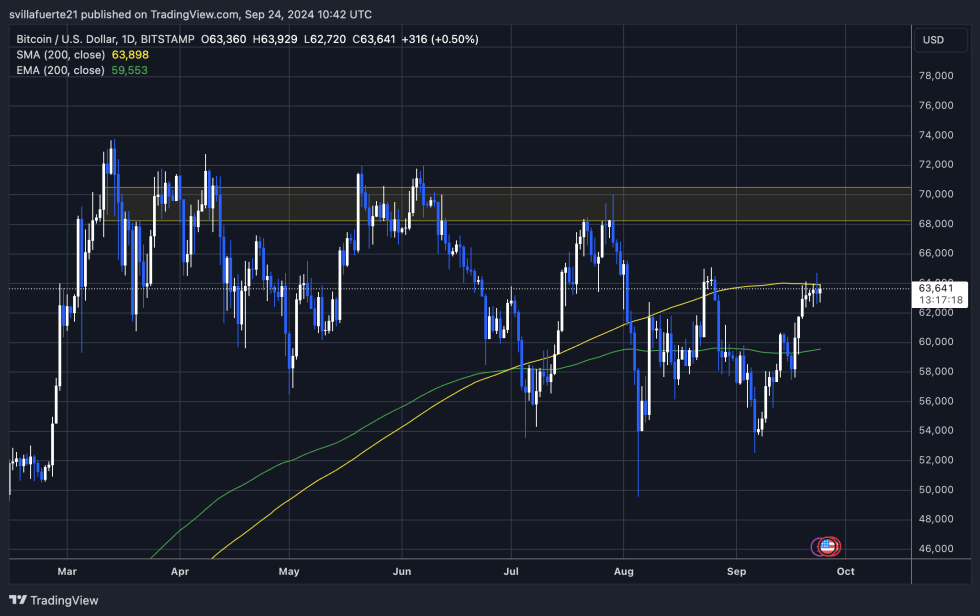
Bulls are becoming increasingly optimistic, particularly with the recent change in market sentiment triggered by the Federal Reserve’s interest rate cut announcement. This has infused the market with renewed energy, heightening the chance of a Bitcoin rally. Nonetheless, vigilance is warranted, as there remains a possibility for Bitcoin to revisit lower demand levels around $60,000 before ascending higher.
If BTC does not secure a close above the daily 200 MA soon, this situation could become more likely, and a decline to $60,000 might provide another purchasing opportunity ahead of the next upward movement. Traders are acutely watching for a definitive shift in either direction to ascertain the market’s forthcoming actions.
Featured image from Dall-E, chart from TradingView


 Dutch
Dutch English
 French
 German
 Greek
Greek Italian
 Portuguese
 Russian
 Spanish