The price of Bitcoin (BTC) has risen by 6% over the past month. Nevertheless, the current trend strength, as reflected by the ADX, indicates signs of softness. Furthermore, recent netflows of BTC into exchanges hint at a more cautious approach among holders.
In order for BTC to aim for a new all-time high, it needs to surpass the $68,506 resistance level. However, if it fails to maintain critical support levels, a pullback may occur.
BTC Current Trend Is Weaker Than It Was Days Ago
The ADX for Bitcoin (BTC) currently stands at 33.55, reflecting moderate trend strength. The Average Directional Index (ADX) gauges the intensity of a price trend, irrespective of its upward or downward movement.
A reading above 20 indicates a trend is gaining momentum, while values exceeding 50 signify a very strong trend. With the ADX at 33.55, the trend is noticeable but not overwhelmingly robust.
Read more: Bitcoin (BTC) Price Prediction 2024/2025/2030

Currently, BTC is experiencing an uptrend, although this trend is considerably weaker compared to the recent past when the ADX exceeded 50. This decline in trend strength indicates that the momentum propelling BTC higher has diminished.
A weakening trend erodes confidence in the continued upward trajectory, raising the likelihood of BTC either consolidating or undergoing a pullback instead of maintaining its upward surge.
BTC Netflow Presents an Intriguing Scenario
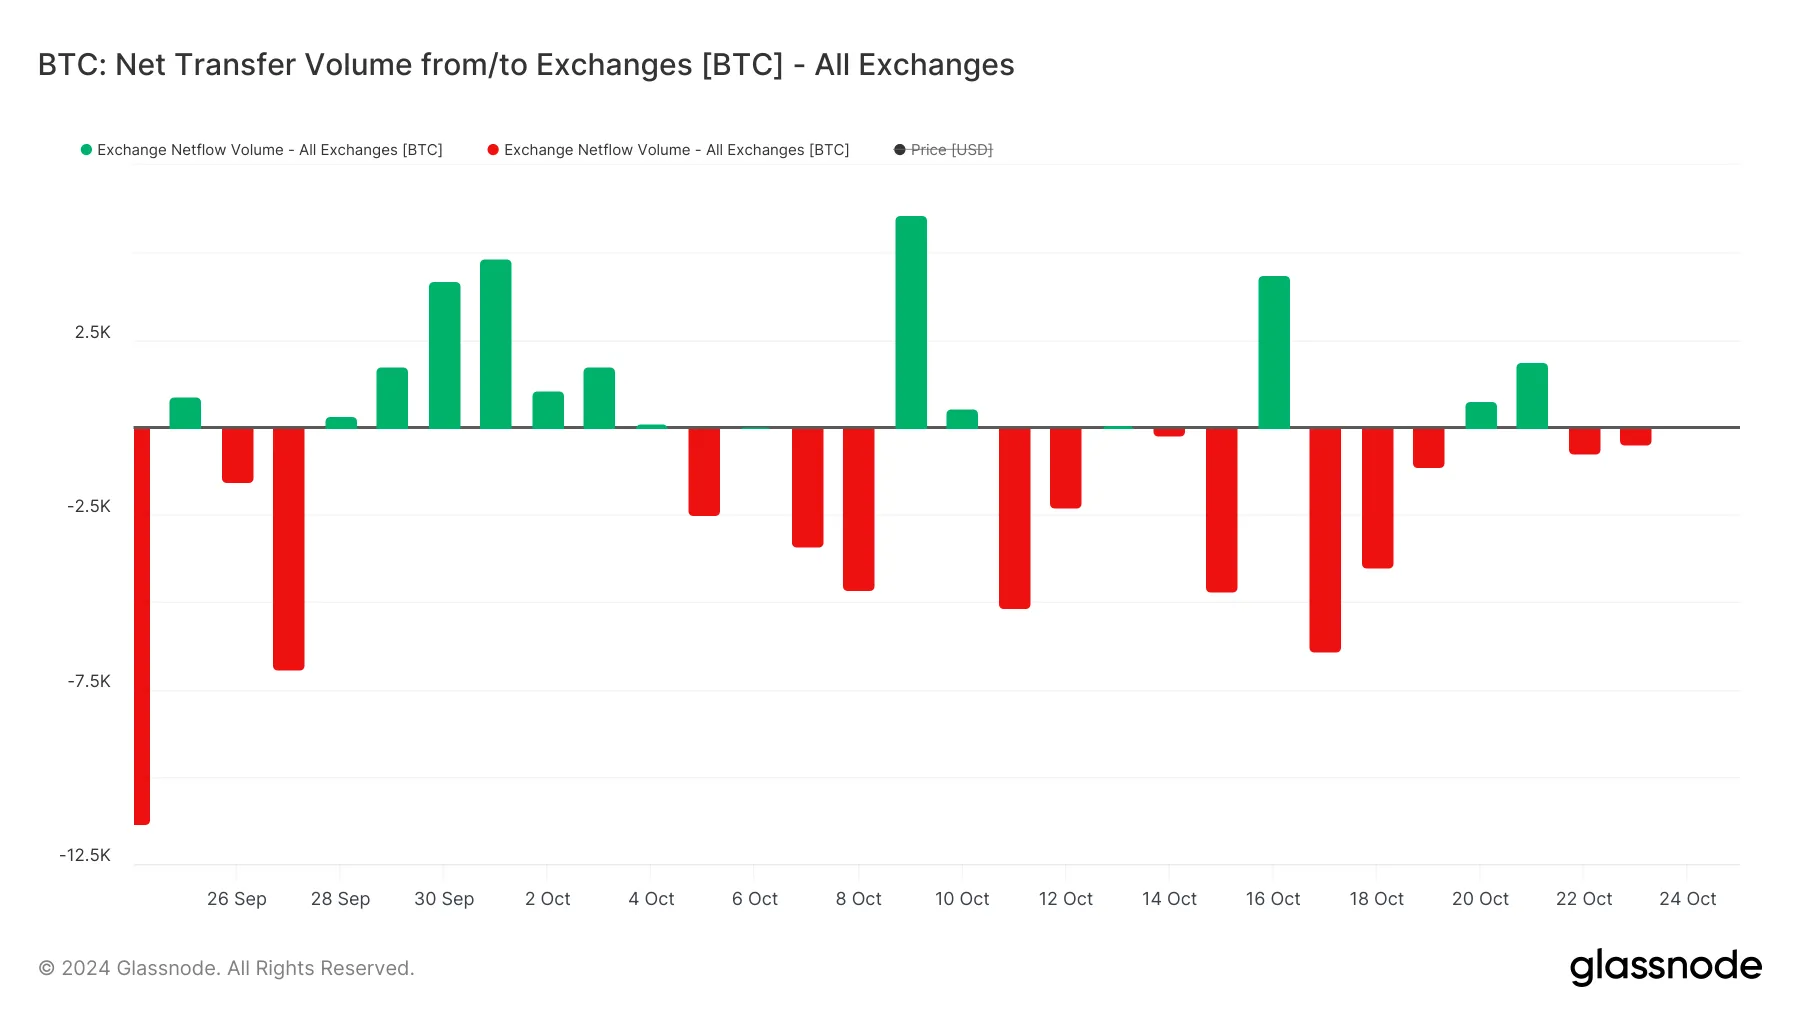
From October 17 to October 19, BTC saw a net transfer volume of approximately 12,000 BTC into exchanges, indicating notable net inflows. Generally, when users transfer assets off exchanges, it signals bullish sentiment, as it suggests they do not intend to sell.
Conversely, an increase in net inflows to exchanges may suggest that holders are gearing up to sell their BTC, potentially resulting in augmented selling pressure.

Following three days of negative netflows — where more BTC exited exchanges than entered — the trend briefly turned positive and has since been erratic over the last two days. Although recent netflows have dipped back into negative territory, the volume is considerably lower than the spike noticed from October 17 to October 19.
This alteration implies that holders might be experiencing reduced confidence, and sentiment could be shifting towards increased caution, curtailing the likelihood of robust bullish momentum in the short term.
BTC Price Prediction: Is a New All-Time High Imminent?
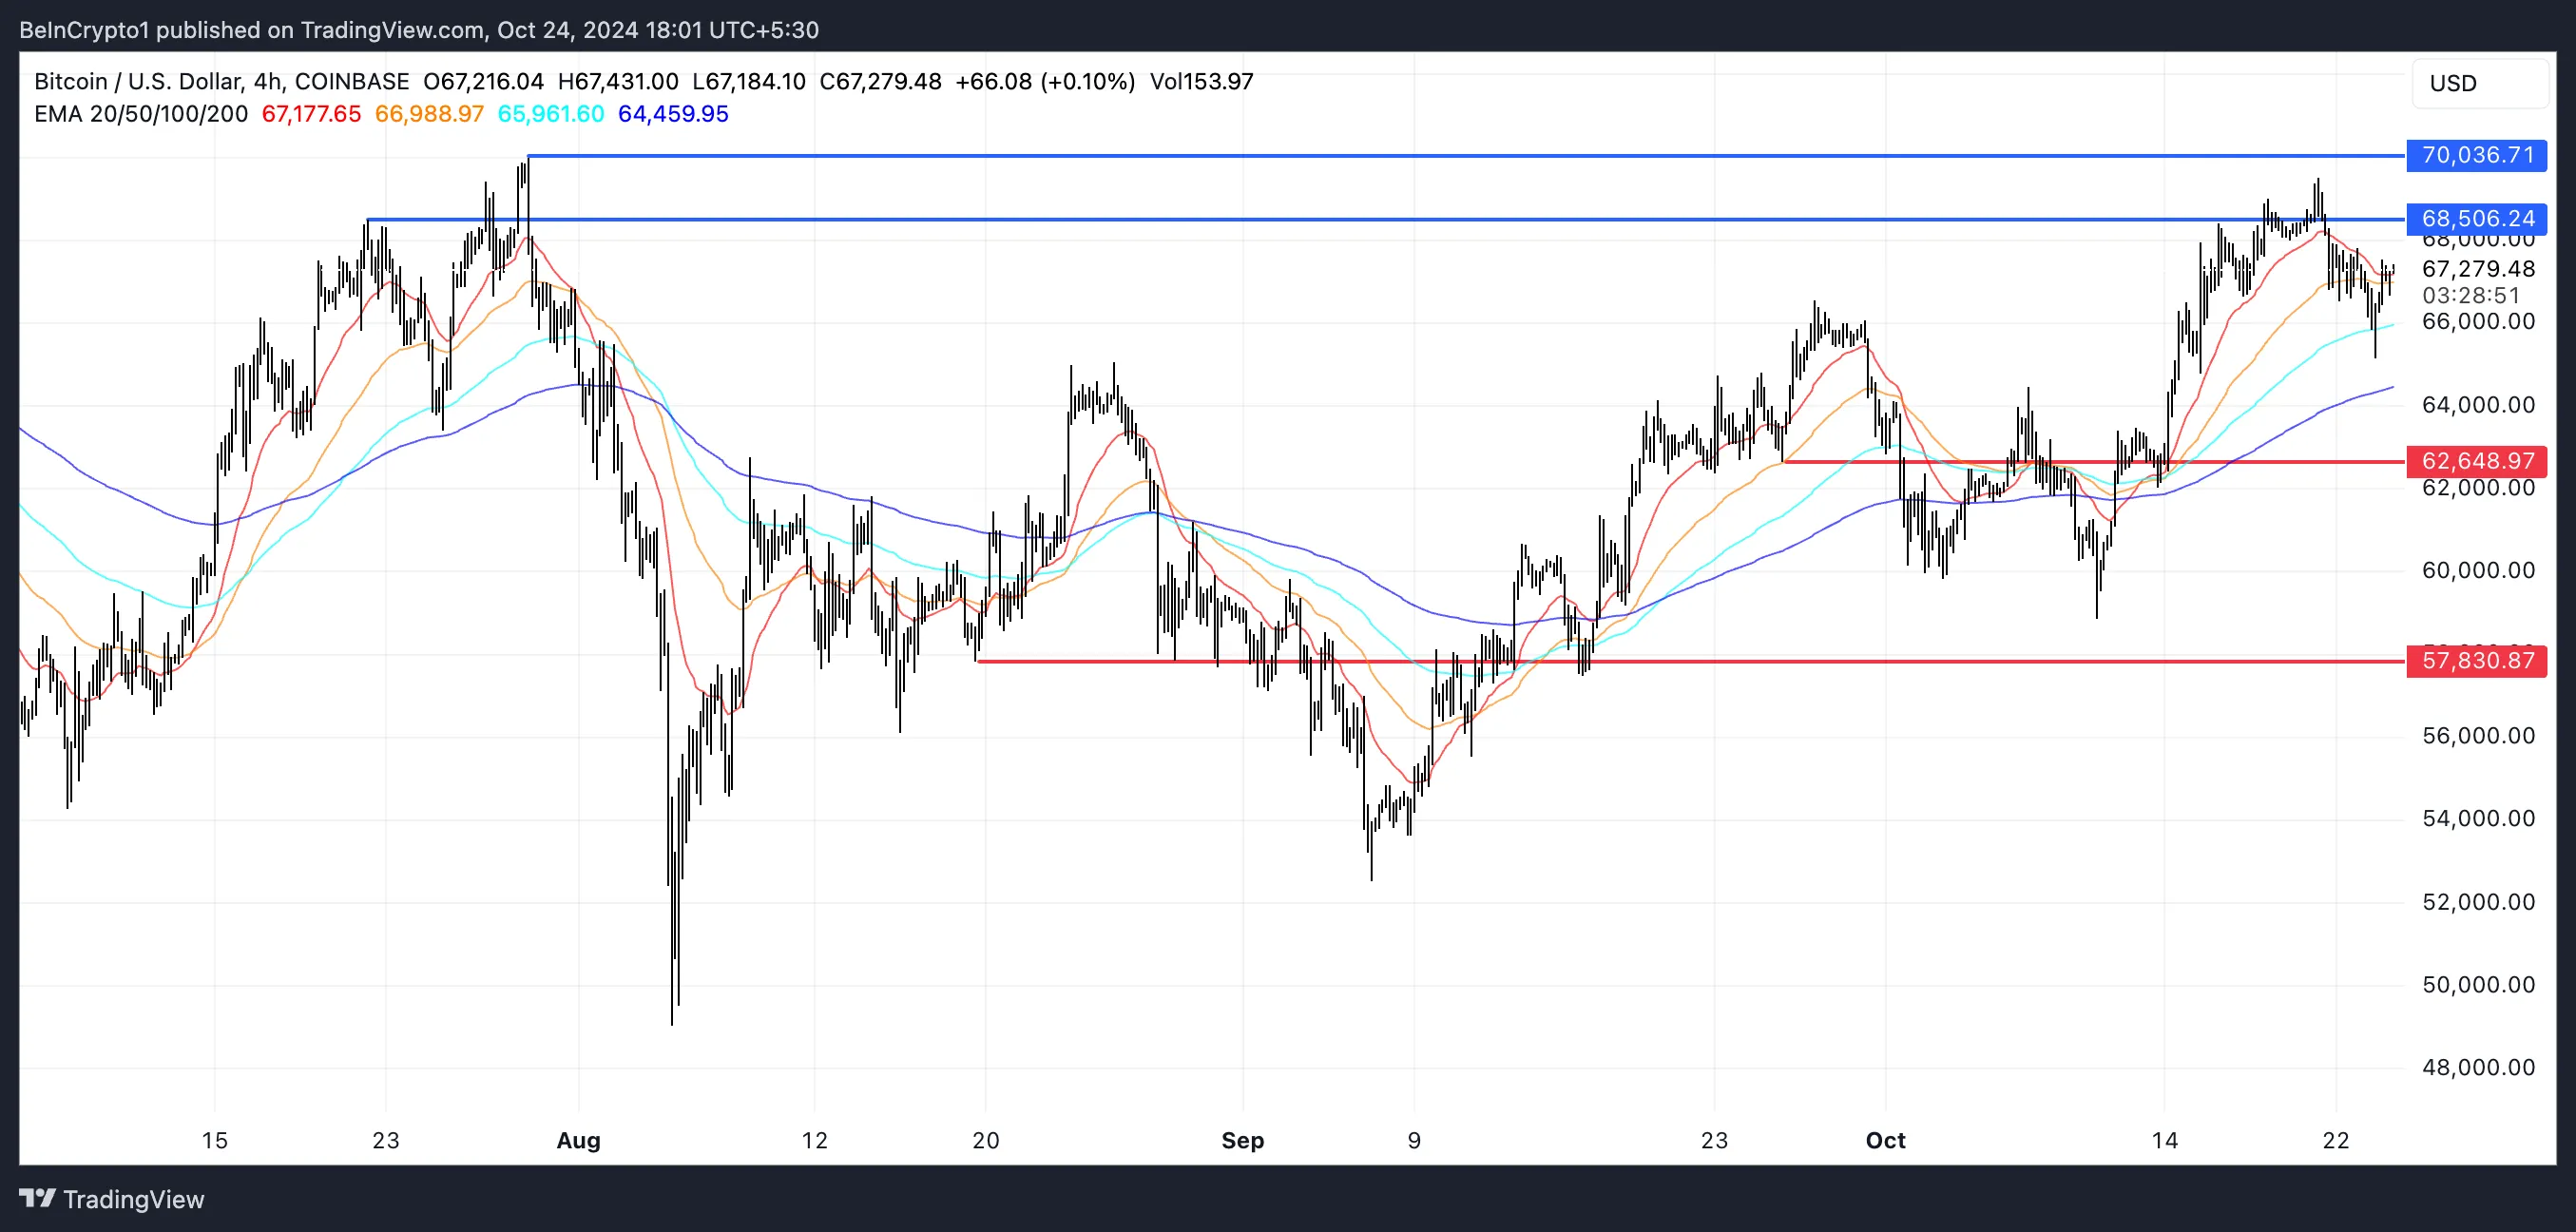
The BTC price chart indicates that the short-term EMA lines remain above the long-term lines, which is a bullish indicator. Nonetheless, the distance between these EMAs has decreased compared to a few days ago, signaling a weakening bullish momentum.
This could imply that the upward trend is losing vigor and that the market has entered a more cautious phase.
Read more: What Is a Bitcoin ETF?

If BTC can surpass the resistance level at $68,506, it could potentially rise further and hit $70,036, establishing a new all-time high.
Conversely, if the current trend shifts, the BTC price may test the support level at $62,648. Should this level fail to hold, BTC may decline further, with the next major support positioned around $57,830.
Disclaimer
In accordance with the Trust Project guidelines, this price analysis article is intended solely for informational purposes and should not be construed as financial or investment advice. BeInCrypto is dedicated to providing accurate and unbiased reporting; however, market conditions may change without warning. Always perform your own research and consult with a professional before making any financial decisions. Please be aware that our Terms and Conditions, Privacy Policy, and Disclaimers have been updated.


