By using this site, you agree to the Privacy Policy and Terms of Use.
Accept
KriptotekaKriptoteka
  • Home
  • News
    • Web3
    • Crypto News
    • Market Analysis
  • Market
    • AI
    • Altcoins
    • Bitcoin
    • Blockchain
    • CEX
    • Defi
    • DePIN
    • DEX
    • ETFs
    • Ethereum
    • Gaming
    • ICO/IDO
    • Institutions
    • L1&L2
    • Meme
    • NFT tech
    • RWA
    • Stable coins
  • Data
  • Events
  • Learn
  • Reports
  • Podcasts
  • Pro membership
Reading: Bitcoin MVRV Ratio Suggests BTC Cycle Top Still Pending
Share
Notification Show More
Font ResizerAa
Font ResizerAa
KriptotekaKriptoteka
  • Home
  • News
  • Market
  • Data
  • Events
  • Learn
  • Reports
  • Podcasts
  • Pro membership
  • Home
  • News
    • Web3
    • Crypto News
    • Market Analysis
  • Market
    • AI
    • Altcoins
    • Bitcoin
    • Blockchain
    • CEX
    • Defi
    • DePIN
    • DEX
    • ETFs
    • Ethereum
    • Gaming
    • ICO/IDO
    • Institutions
    • L1&L2
    • Meme
    • NFT tech
    • RWA
    • Stable coins
  • Data
  • Events
  • Learn
  • Reports
  • Podcasts
  • Pro membership
Have an existing account? Sign In
Follow US
  • Advertise
© 2022 Foxiz News Network. Ruby Design Company. All Rights Reserved.
Kriptoteka > Crypto News > Bitcoin MVRV Ratio Suggests BTC Cycle Top Still Pending
Crypto News

Bitcoin MVRV Ratio Suggests BTC Cycle Top Still Pending

marcel.mihalic@gmail.com
Last updated: October 4, 2024 7:20 am
By marcel.mihalic@gmail.com 4 Min Read
Share
SHARE

The current trend in the Bitcoin Market Value to Realized Value (MVRV) Ratio suggests that a peak has yet to be reached in this cycle.

Bitcoin MVRV Ratio Has Not Yet Reached Previous Cycle Peaks

According to a recent post on X, market intelligence platform IntoTheBlock sheds light on the historical trends of the Bitcoin MVRV Ratio. The “MVRV Ratio” is a well-known BTC on-chain indicator that compares the market cap and realized cap of the asset.

The market cap represents the total value of the cryptocurrency’s supply at its current price. Conversely, the realized cap is an on-chain capitalization model that values each coin based on its last transactional price, which is considered its ‘true’ value.

By assuming that the last transfer for the majority of coins reflects the last time they changed hands, the price at that time serves as their cost basis. Therefore, the realized cap estimates the sum of the cost basis of all BTC tokens.

In simpler terms, it indicates the overall capital that investors have invested in the cryptocurrency, while the market cap reflects its current valuation held by investors.

Thus, the MVRV Ratio, which juxtaposes these two metrics, provides insights into the profit or loss status of the Bitcoin userbase. A ratio greater than 1 indicates that investors are in a net profit state, while a ratio under this threshold signifies that losses are prevalent.

Here is a chart illustrating the trend of the Bitcoin MVRV Ratio over the past decade:

Bitcoin MVRV Ratio

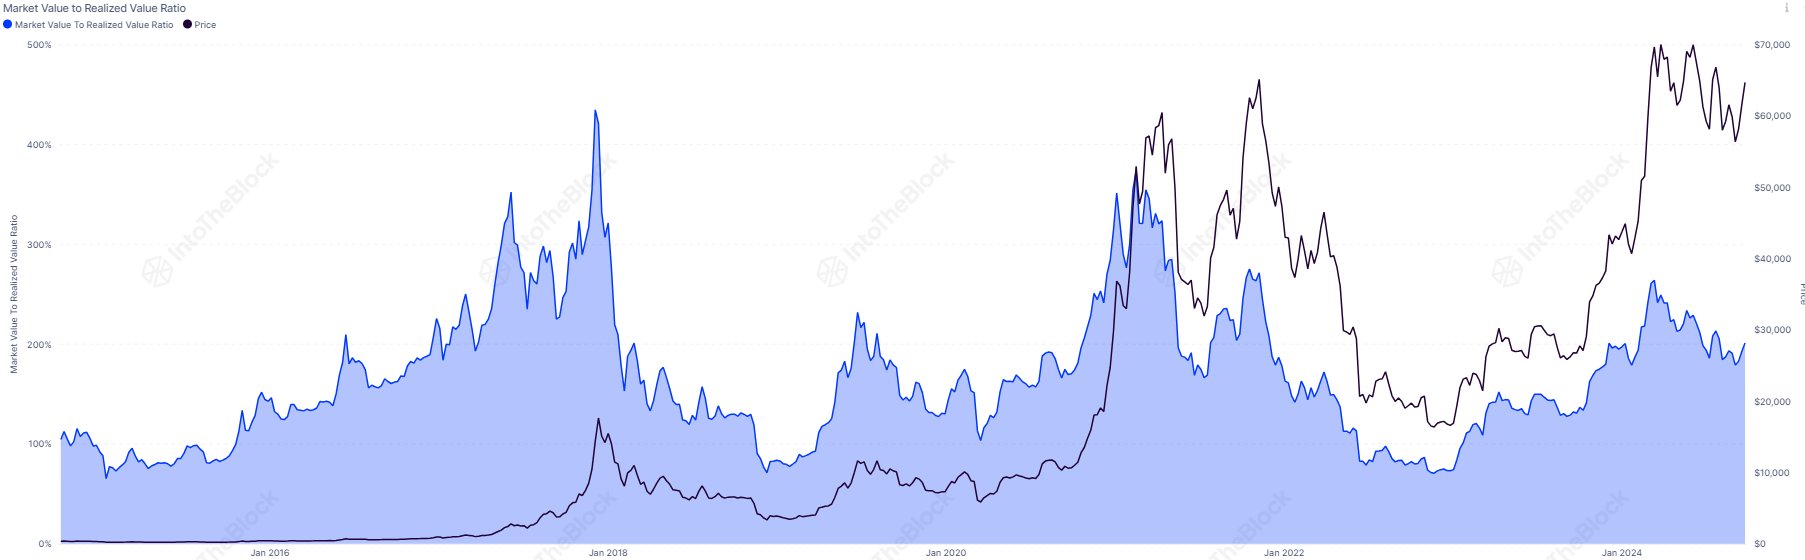
The metric has shown a downward trend recently | Source: IntoTheBlock on X

As evident in the chart above, the Bitcoin MVRV Ratio experienced a spike during the rally to a new all-time high (ATH) in the first quarter of the year, as investors’ profits swelled.

Historically, Bitcoin’s peaks have tended to occur as holder gains have inflated, prompting investors to sell when their profits reach substantial levels.

Consequently, high MVRV Ratio values can indicate that the cryptocurrency is becoming overpriced, signaling a potential correction. Earlier this year, at the peak price, the indicator reached a high of 2.64, illustrating that the market cap had surpassed the realized cap by more than double.

IntoTheBlock notes that the highest recorded value of this indicator was 4.35 during the 2017 bull market and 3.7 during the 2021 bull market. The recent peak in the MVRV Ratio has yet to approach either of these figures, and the analytics firm concludes that the current value “appears relatively low to indicate a market top.”

BTC Price

As of this writing, Bitcoin is trading around $60,600, reflecting a decline of approximately 7% over the past week.

Bitcoin Price Chart

The coin appears to be experiencing bearish conditions recently | Source: BTCUSDT on TradingView

Featured image from Dall-E, IntoTheBlock.com, chart from TradingView.com

You Might Also Like

Netherlands Introduces Crypto Tax Compliance Aligned with EU

SUI’s RSI Declines: Bearish Signals Suggest More Downside Ahead

$22M Crypto Scam Takes $21.6M from 40,000 Investors

XRP Active Addresses Soar—Is a Market Shift on the Horizon?

Bitcoin’s Capital Inflows Surge: Investors’ Demand Grows Strong

Share This Article
Facebook Twitter Email Print
Previous Article Sustainable Textile Traceability Through Blockchain Innovation
Next Article Is It Too Late to Buy HIPPO? Sudeng Price Soars 48% Today![embed]https://www.youtube.com/watch?v=CVhoXK2hNlA[/embed]
Leave a comment

Leave a Reply Cancel reply

Your email address will not be published. Required fields are marked *

Stay Connected

FacebookLike
TwitterFollow
YoutubeSubscribe
TelegramFollow
- Advertisement -
Ad image

Latest News

4 Cryptos to Challenge Solana: Potential Growth for Investors
Defi
Bitcoin ETF Inflows Exceed $3B, Demand Reaches 6-Month Peak
ETFs
Japan’s Push for Bitcoin and Ethereum ETFs Gains Momentum
Institutions
Ripple Appeals Court Ruling on XRP’s Institutional Sales
Meme
//

We influence millions of users and is the number one Crypto and Web3 news network on the planet

Sign Up for Our Newsletter

Subscribe to our newsletter to get our newest articles instantly!

© 2022 Foxiz News Network. Ruby Design Company. All Rights Reserved.
nl Dutchen Englishfr Frenchde Germanel Greekit Italianpt Portugueseru Russianes Spanish
en en
Join Us!

Subscribe to our newsletter and never miss our latest news, podcasts etc..

Zero spam, Unsubscribe at any time.
Welcome Back!

Sign in to your account

Lost your password?