


The price of Bitcoin Cash has started a significant upward trend, breaking through the $350 resistance. BCH is currently consolidating and may seek further gains above the $385 resistance level.
- Bitcoin Cash has begun a notable increase, surpassing the $350 mark.
- The price is currently above $365 and the 100-hour simple moving average.
- A bullish trend line is forming, providing support at $355 on the hourly chart for the BCH/USD pair (data feed from Kraken).
- The pair may initiate another upward move if it breaks through the $380 resistance area.
Bitcoin Cash Price Initiates New Surge
After establishing a base above the $315 level, Bitcoin Cash has kicked off a new surge. BCH has outperformed both Bitcoin and Ethereum with gains exceeding 20%. The price clearly moved above the $350 resistance level.
The price also exceeded $365, testing the $385 resistance area. A high was reached near $385.95, and the price is now undergoing a correction. There was a slight dip below the $375 mark. The price retraced and tested the 23.6% Fibonacci retracement level of the upward movement from the $318.02 swing low to the $385.95 high.
Bitcoin Cash is presently trading above $365 and the 100-hour simple moving average. Additionally, a bullish trend line is forming with support at $355 on the hourly chart of the BCH/USD pair. This trend line is near the 50% Fibonacci retracement level of the upward movement from the $318.02 swing low to the $385.95 high.
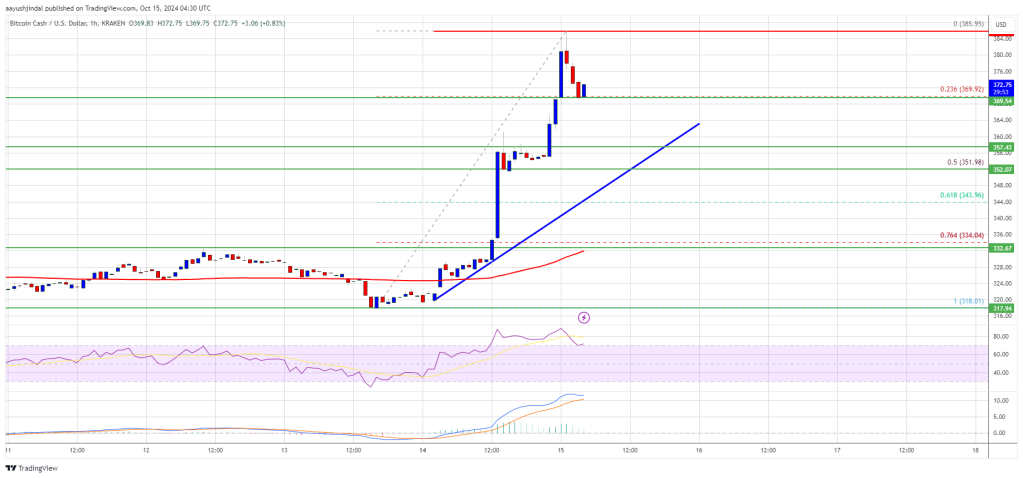
Immediate resistance on the upside is around the $380 level. A decisive move above the $380 resistance could signal a substantial increase. The next significant resistance is $385, beyond which the price might surge towards the $400 level. Further gains could push the price toward the $420 resistance zone.
Potential Decline for BCH?
If Bitcoin Cash fails to break above the $380 resistance, it may begin a fresh downward trend. Initial support on the downside is near the $365 level. The next significant support level is near the $355 mark or the trend line.
If the price cannot maintain above the $355 support, it might test the $340 support level. Any additional losses could lead the price toward the $332 zone in the near future.
Technical indicators
4-hour MACD – The MACD for BCH/USD is losing momentum in the bullish territory.
4-hour RSI (Relative Strength Index) – The RSI is currently positioned above the 50 level.
Key Support Levels – $365 and $355.
Key Resistance Levels – $380 and $385.


 Dutch
Dutch English
 French
 German
 Greek
Greek Italian
 Portuguese
 Russian
 Spanish