


Coinspeaker
Is a Bitcoin Bull Run on the Horizon? Essential On-Chain Metrics Indicate a Possible Market Shift
Latest insights from CryptoQuant reveal that Bitcoin
BTC
$63,741
24h volatility:
0.4%
Market cap:
$1.26 T
Vol. 24h:
$28.22 B
might be preparing for a significant upward movement. An analyst from CryptoQuant, known as Darkfost, suggests that key on-chain metrics indicate a shift towards a bullish phase, with signs that market sentiment is improving.
Essential On-Chain Metrics Indicating Recovery
One of the main indicators pointed out by Darkfost is the 7-day Simple Moving Average (SMA) of the Fund Flow Ratio, which is currently at 0.05. This level has historically signified the conclusion of bear markets or the onset of new bullish phases. The recent uptick in the Fund Flow Ratio suggests an increase in investor activity on the exchanges, often a precursor to significant price increases.
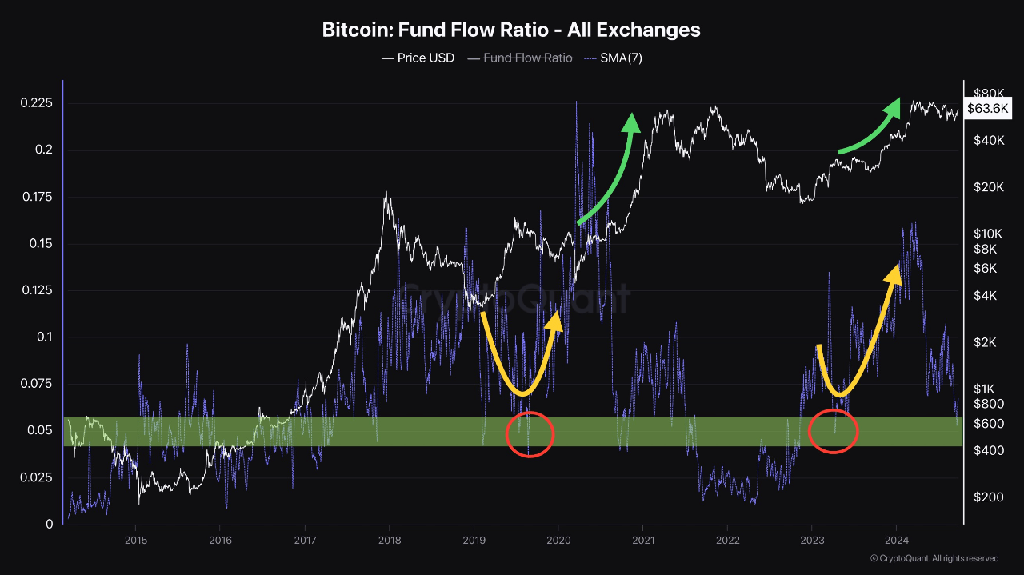
Source: CryptoQuant
Another significant metric indicating recovery is the 30-day SMA of the Estimated Leverage Ratio, which tracks the leverage utilized in Bitcoin trading. Currently, this ratio is on the rise, operating within a support range of 0.15 and 0.175, reflecting increased confidence among market participants. The growing leverage is further supported by heightened interest in futures ETFs and Bitcoin options trading.
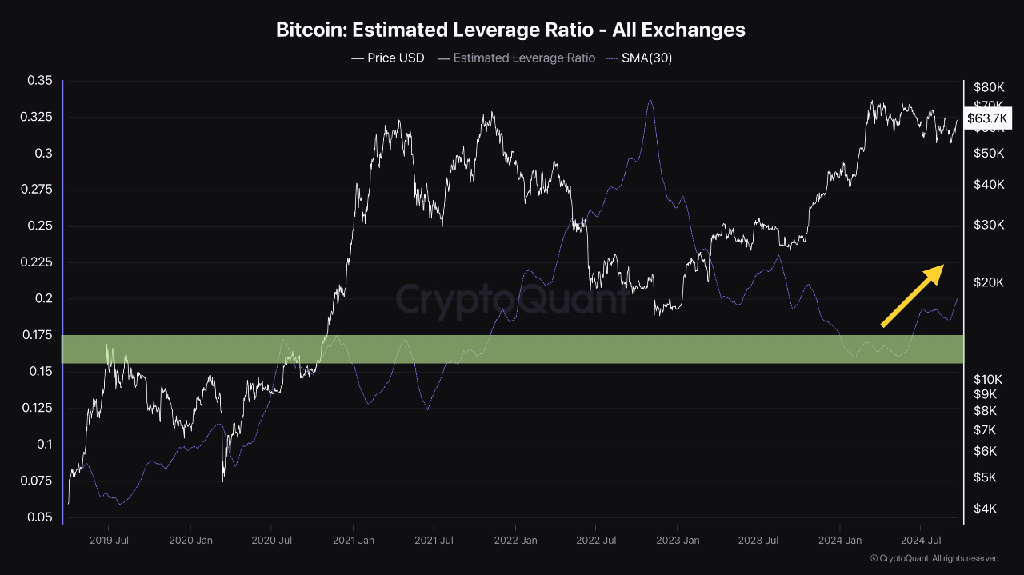
Source: CryptoQuant
Darkfost also emphasizes the importance of the 30-day Exponential Moving Average (EMA) of Binary Coin Days Destroyed (CDD). This metric tracks the actions of long-term Bitcoin holders. A substantial increase in this metric typically indicates the conclusion of a bear market phase. Currently, long-term holders appear to be positioning for future profits, which could provide additional support for Bitcoin’s price in the months to come.
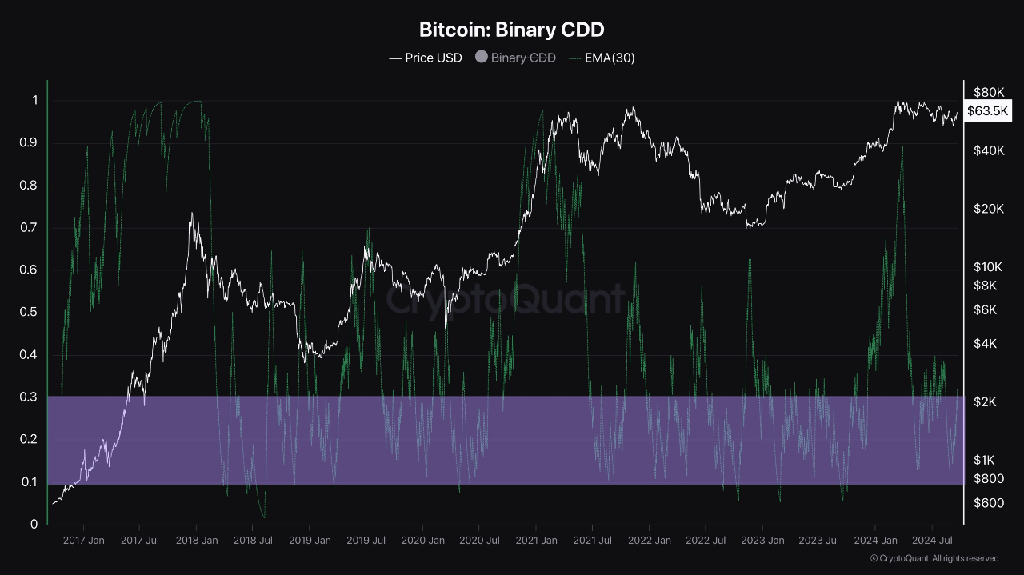
Source: CryptoQuant
Historical Patterns Suggest a Bullish Breakout
In addition to on-chain data, historical cycle patterns also indicate that Bitcoin might be close to a breakout. In a recent post, pseudonymous analyst Rekt Capital pointed out that Bitcoin tends to emerge from its reaccumulation phase approximately 154-161 days following a halving event. If this holds true, a breakout could be imminent, as 157 days have elapsed since the latest halving.
While historical patterns do not guarantee future movements, Bitcoin exhibited similar behavior in 2016 and 2020. Moreover, this year, the typically bearish month of September surprised many by closing 9% in the green, marking its second-best performance in September since 2016.
Long-Term Perspective Remains Optimistic
The long-term outlook for Bitcoin is still promising. It remains uncertain when or how significant the next price increase will be, but current data suggests that Bitcoin may be on the verge of a powerful rally. Currently, Bitcoin sits just 14.6% below its previous peak of $73,738, and the upcoming days could be crucial in determining Bitcoin’s price direction.
In the coming months, the forthcoming U.S. elections are expected to impact market sentiment, though experts predict the effect may be slight. Both candidates have shown interest in cryptocurrency, with Trump being more vocal and demonstrating robust support.
next
Is a Bitcoin Bull Run on the Horizon? Essential On-Chain Metrics Indicate a Possible Market Shift


 Dutch
Dutch English
 French
 German
 Greek
Greek Italian
 Portuguese
 Russian
 Spanish