


Concerns are mounting regarding Bitcoin’s price movements following an unsuccessful attempt to surpass key resistance levels, with bearish indicators becoming apparent. An analysis from TradingView by the analyst RLinda suggests that Bitcoin might be poised to reverse the gains of last week, experiencing significant correction due to the emergence of a bearish engulfing pattern.
Unsuccessful Attempt to Surpass $69,000 Signals Bearish Reversal for Bitcoin
RLinda’s examination of Bitcoin’s price movement is centered around a newly forming bearish engulfment candlestick pattern on the daily candlestick timeframe. Last week, Bitcoin saw a significant rally, bringing it into a notable buying zone near $68,900.
Related Reading
In spite of the bullish trend, Bitcoin bulls were unable to push the price above the $69,000 resistance zone, facing multiple rejections as the cryptocurrency attempted to reach this level.
RLinda’s analysis pointed out that this failure to break through has led to the creation of a bearish engulfment pattern over the last three daily candlestick bars, indicating that sellers are regaining control.
The bearish engulfment pattern, characterized by the latest candle completely enveloping the previous day’s candle, is a strong indicator of reversal, suggesting that the upward momentum may have exhausted. This pattern, along with the failure to surpass the $69,000 zone, implies that Bitcoin may undergo a more profound correction.
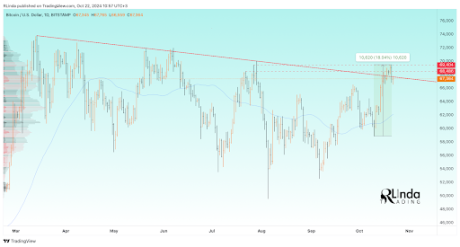
RLinda further emphasizes that the recent rally seems to have been a false breakout from the descending resistance trendline established since Bitcoin reached its all-time high of $73,737. This descending trendline has consistently limited Bitcoin’s price increases since March. Although last week’s rally appeared to breach this level, the subsequent rejection indicates the breakout was not sustainable.
Consequently, the analyst states that Bitcoin has returned to a consolidation phase just below this trendline. Continued consolidation raises the chances of a more substantial correction.
What Is the Potential Depth of a Bitcoin Price Correction?
Looking ahead, RLinda anticipates a potential correction in Bitcoin’s price, with the initial target for decline set around $65,000. If this level fails to hold, further declines could push Bitcoin down to $61,000, $58,000, and possibly as low as $57,000.
Related Reading
However, this bearish perspective is not definitive. RLinda suggests that the bearish trend could be invalidated if Bitcoin manages to break above $69,400. A breakout above would affirm the bullish momentum and enable a sustained breakout from the descending triangle.
As of this writing, Bitcoin is trading at $66,670, reflecting a 0.6% decline over the last 24 hours. The current price movements are in line with RLinda’s prediction of consolidation beneath the descending resistance trendline.
The upcoming days could be crucial in determining how much Bitcoin wraps up October (Uptober) in a favorable position. Key resistance levels to monitor include $66,500 and $65,000, while support levels to pay attention to are $68,400, $69,400, and $71,500.
Featured image created with Dall.E, chart from Tradingview.com


 Dutch
Dutch English
 French
 German
 Greek
Greek Italian
 Portuguese
 Russian
 Spanish