Ethereum (ETH) has faced significant challenges lately, resulting in a considerable decline. In the last week, Ethereum’s value has dropped by 9.2%, mirroring the overall weakness in the market.
Nevertheless, the last 24 hours have shown a modest shift in momentum, as ETH experienced a price increase of 3.2%. Although this rise does not compensate for last week’s losses, it could indicate the start of a recovery.
Is Ethereum Approaching the End of Its Correction?
As per the latest analysis by noted crypto analyst Alex Clay on X, Ethereum may be on a gradual path to recovery as its recent bearish trend appears to be winding down.
He stressed that if ETH manages to hold above critical technical levels, particularly the 200-day moving average (MA) and the 200-day exponential moving average (EMA), it would lay a solid groundwork for a potential upward surge.
A decisive move above the $2,500 level could confirm the end of the correction and signal that the asset is ready for recovery. Additionally, while Clay had previously been hopeful about Ethereum reaching much higher price points, he has adjusted his expectations to align with the current market conditions.
#ETH/USD
Imo we are at the end of the $ETH correction
Looking for some consolidation above the Key Zone + 200 MA & 200 EMA confluence
Break above $2500 will serve as confirmation of the beginning of the rally #Ethereum has become a heavy asset, so a $10k target is more of a…
— Alex Clay (@cryptclay) September 9, 2024
Clay remarked, “Ethereum has become a heavy asset, making the $10k target more of a dream than a reality, so I have adjusted my outlook.” Currently, the analyst has set more attainable targets, projecting a mid-term goal of $4,000 and long-term projections ranging from a conservative $6,255 to an optimistic $7,942.
Additional Analysts Focus on Falling Wedge Pattern as Crucial Indicator
In addition to Clay’s analysis, Ethereum’s technical chart has attracted attention from several prominent analysts, including Anup Dhungana and Captain Faibik, who have identified the potential for a bullish breakout for ETH.
For example, Dhungana’s ETH/BTC chart analysis indicates that a bounce from key support levels and a breakout from the falling wedge pattern could lead to a significant increase in Ethereum’s price.
In this context, falling wedges are generally seen as bullish reversal patterns in technical analysis, and confirming a breakout could signify an exponential upward trend.
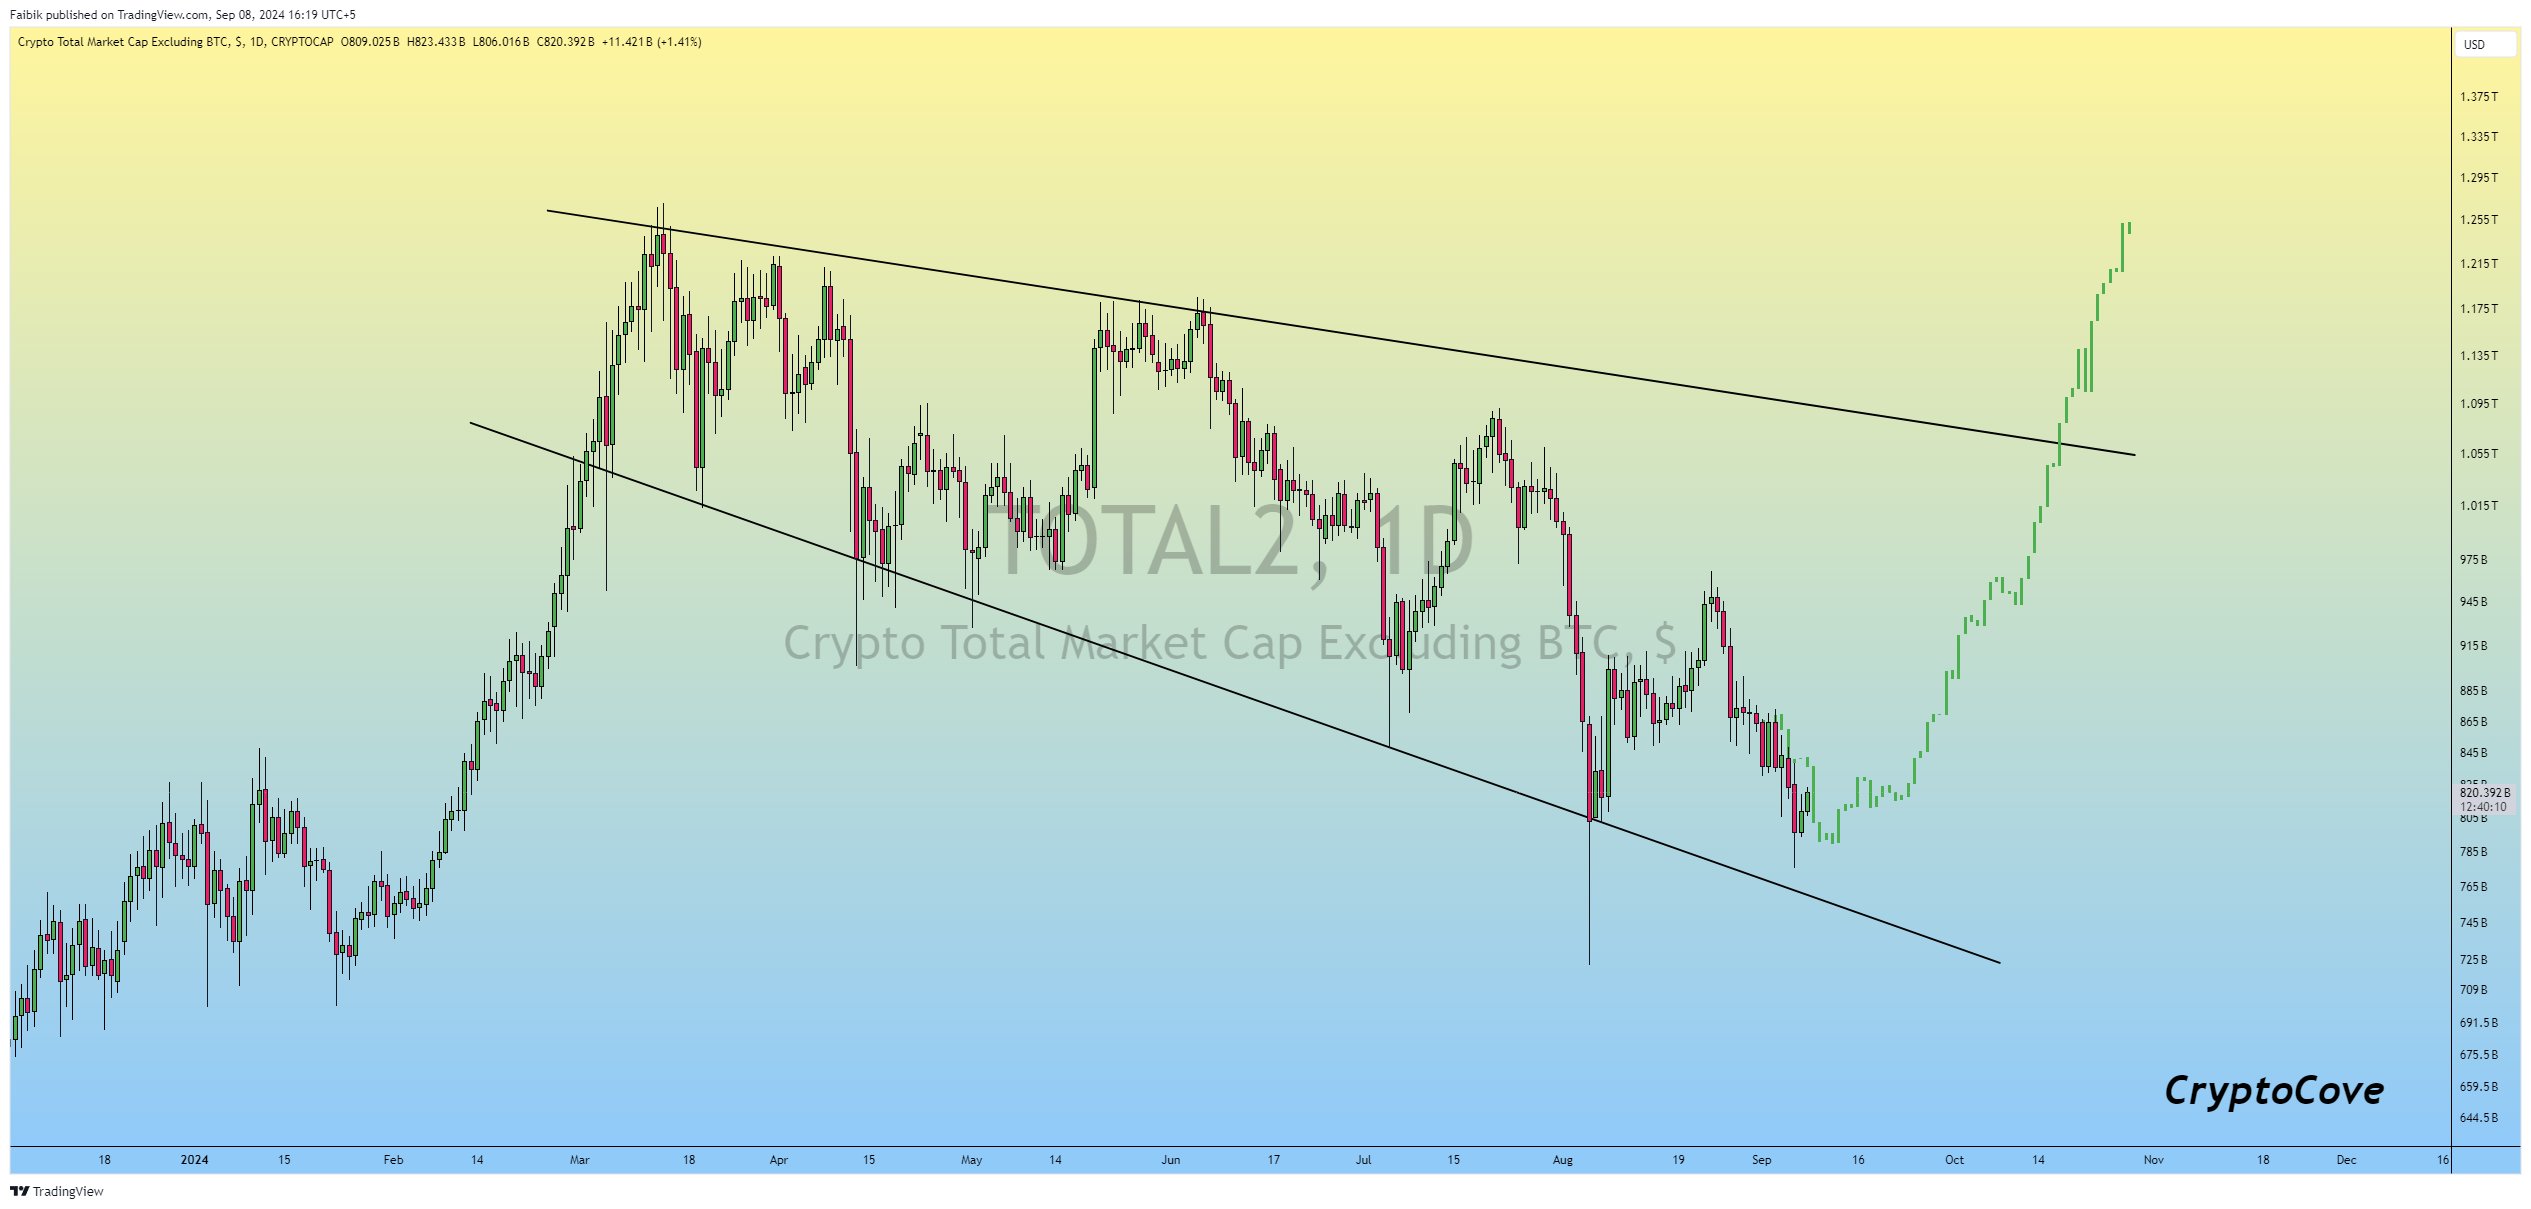
Likewise, Captain Faibik echoed this viewpoint, sharing a chart of the altcoin market that also depicted a falling wedge formation.
Faibik projected that altcoins might break out of the wedge pattern soon, potentially pushing major altcoins, including ETH, towards a recovery in the fourth quarter of 2024.
He urged investors to stay patient, accumulate altcoins, and be ready for a rebound that could see prices trace back to their March 2024 highs.
Featured image from DALL-E, Chart from TradingView


