


Recent on-chain data indicates a significant drop in Bitcoin Active Addresses, which may signal a bearish trend for BTC.
Bitcoin Active Addresses Experience Their Largest Decline Since 2021
An analyst from CryptoQuant highlighted in a CryptoQuant Quicktake post that BTC Active Addresses have been in decline since March this year. An address is classified as “active” when it is involved in transaction activities on the network, either as a sender or receiver.
The Active Addresses metric tracks the total unique addresses that conduct transfers on the Bitcoin blockchain daily. Unique active addresses are akin to unique users accessing the network, making this metric indicative of BTC’s daily usage.
Below is a chart illustrating the trend in the 100-day Simple Moving Average (SMA) of Bitcoin Active Addresses over the past few years:

The metric's value has been declining in recent months | Source: CryptoQuant
The chart indicates that while the 100-day SMA of Bitcoin Active Addresses was on the rise throughout 2023 and early this year, it has experienced a sharp decline since March. This reversal coincided with BTC hitting a new all-time high (ATH), suggesting that the drop in this indicator is related to the consolidation phase that followed.
Investors are typically thrilled by rapid price movements, while finding sideways trends less engaging, making the current decline in Active Addresses expected. However, the steepness of the drop in the 100-day SMA is noteworthy; its value has already dipped below the lowest point seen during the 2022 bear market and may soon fall beneath the 2021 low as well.
For Bitcoin to sustain a rally, an active user base is crucial, and the recent collapse in this indicator could signify bearish sentiment. “Don’t be surprised if BTC’s price begins to align with the address activity soon,” the quant observes.
Despite the negative trend in Active Addresses, CryptoQuant CEO Ki Young Ju mentioned in an X post that Bitcoin remains in the midst of a bull cycle.
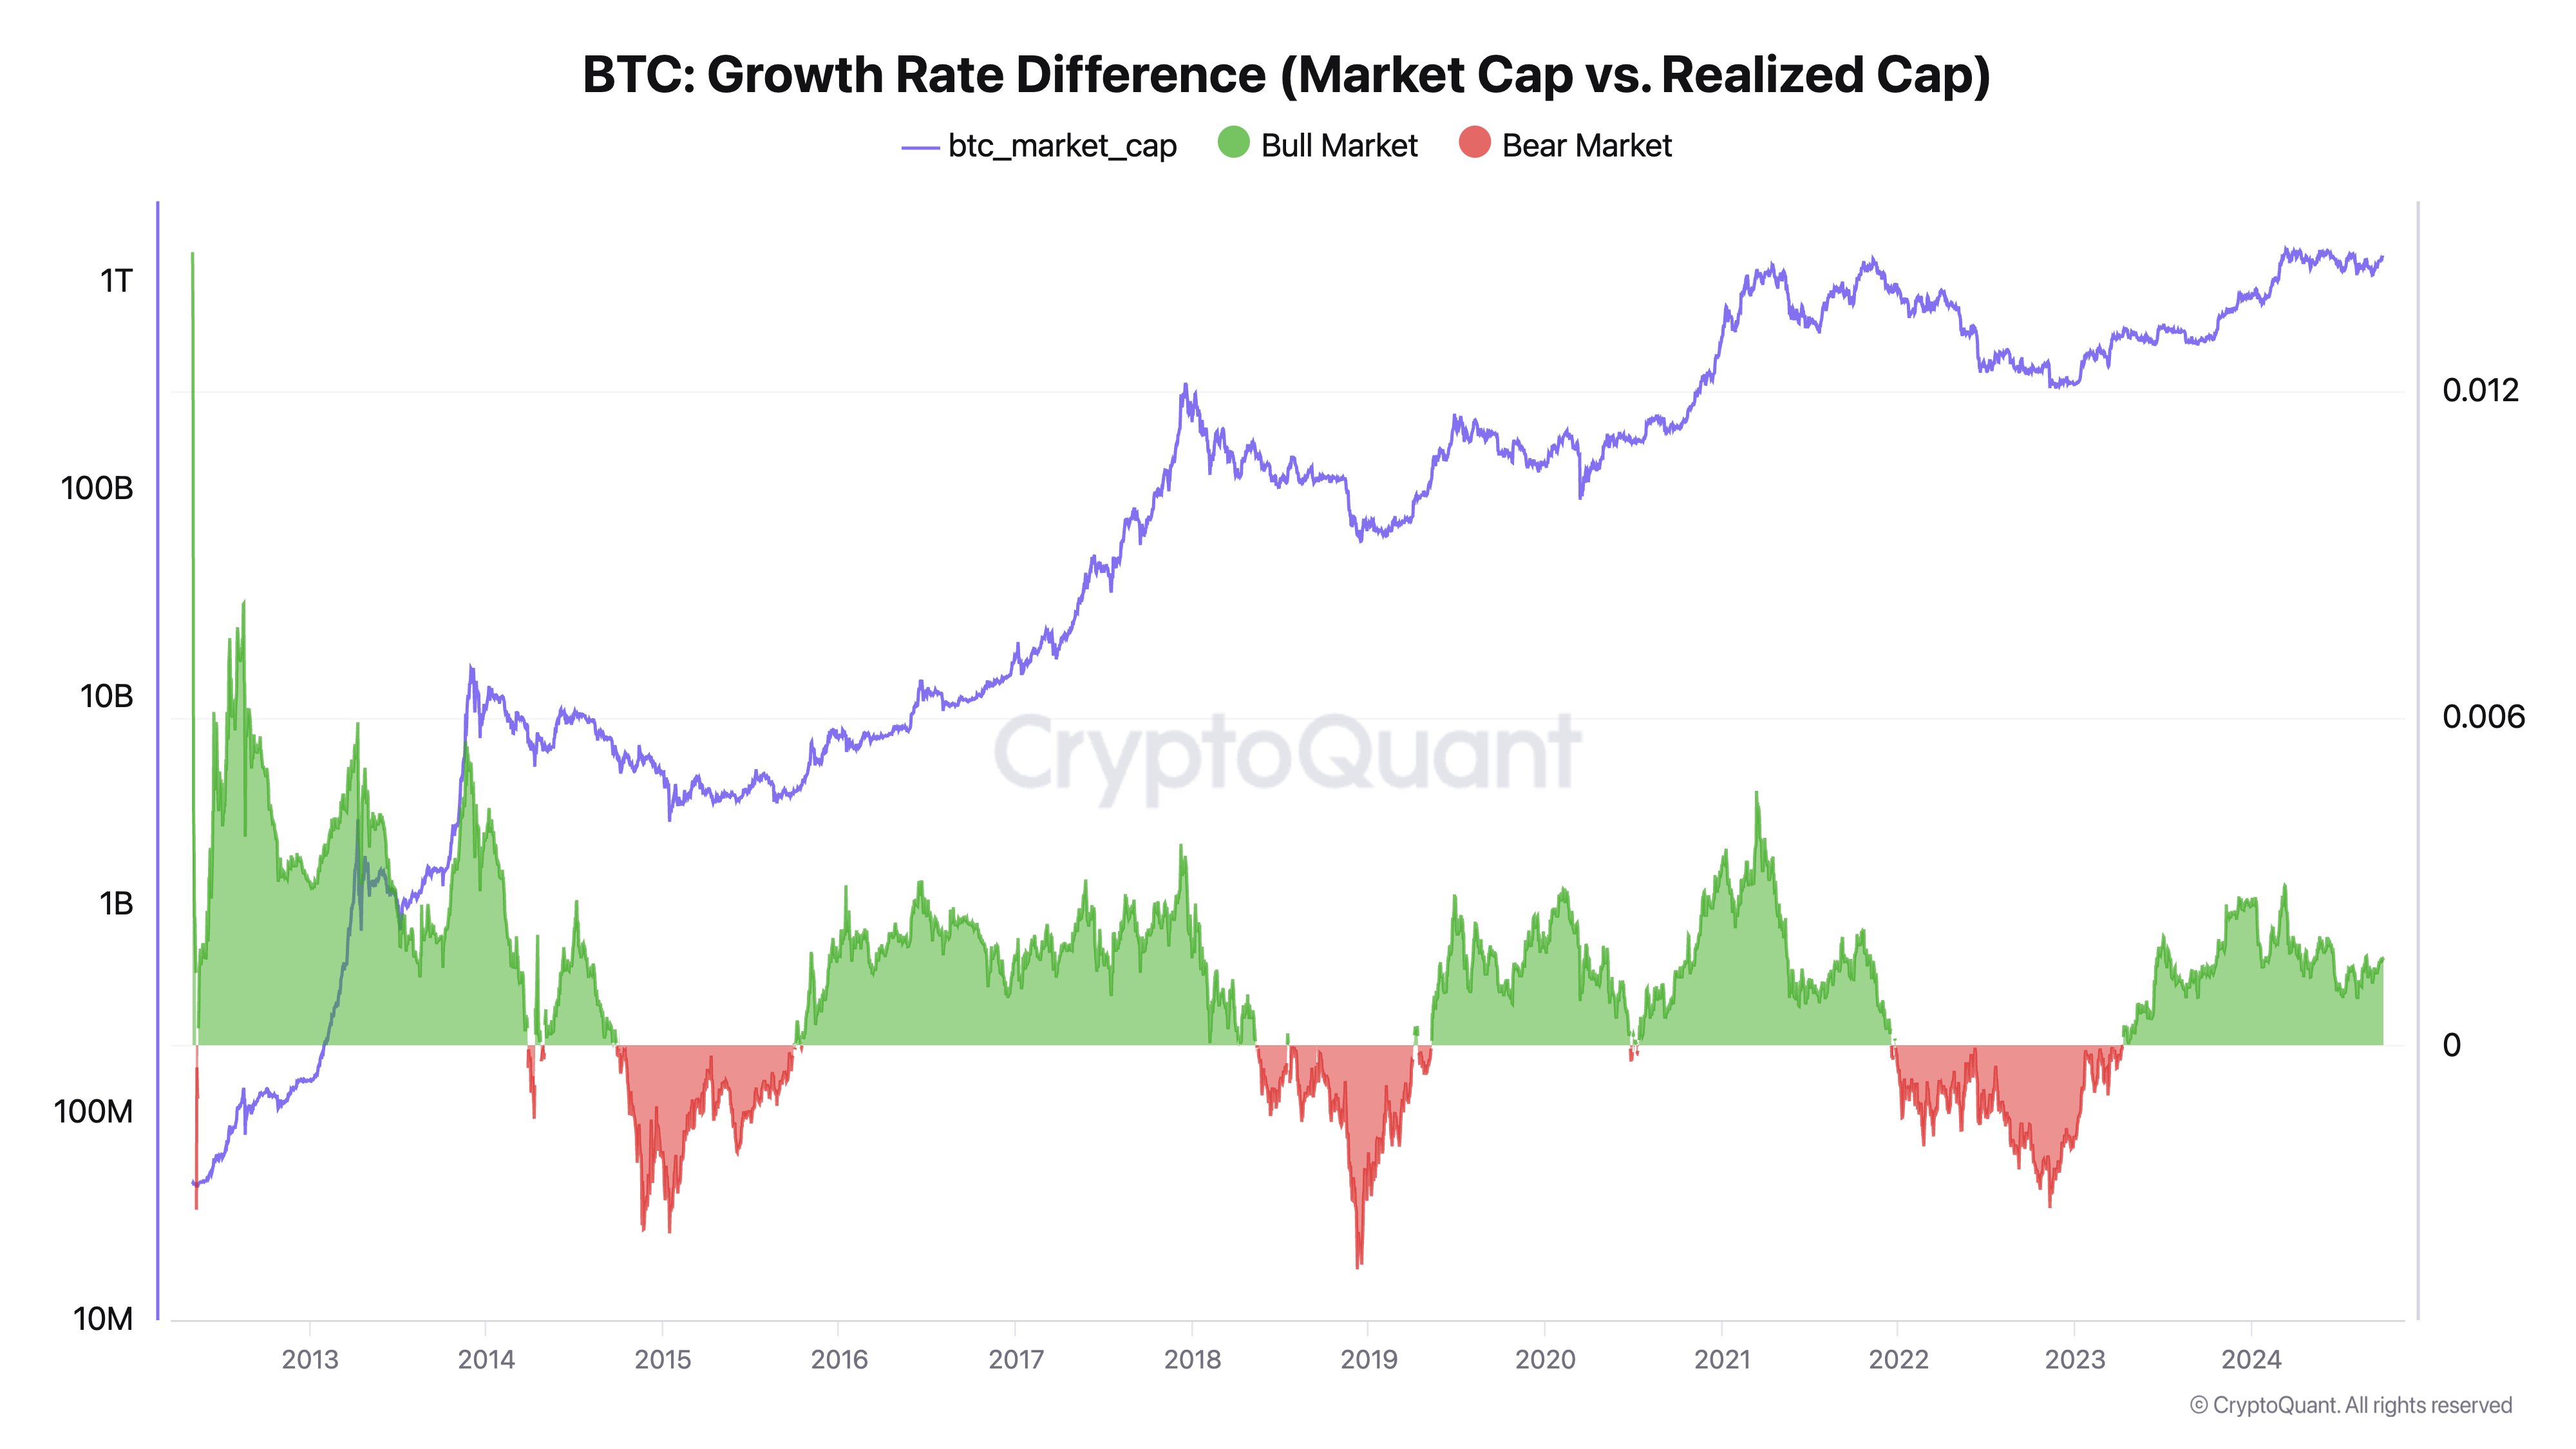
The metric's value has shown positive trends recently | Source: @ki_young_ju on X
The above chart presented by Young Ju displays the Bitcoin Growth Rate Difference, which compares the growth rates of BTC’s market cap and realized cap.
The realized cap is an on-chain capitalization model that reflects the total capital invested by all BTC holders.
Currently, the indicator is positive, indicating that the market cap is growing at a faster pace than the realized cap. “When the market cap rises more rapidly than the realized cap, it often signals a bull market; the opposite may suggest a bear market,” says the CryptoQuant CEO.
BTC Price
Bitcoin has continued its downward trend over the past day, with its price now hovering around $62,700.
The coin's price has experienced a notable dip in recent days | Source: BTCUSDT on TradingView
Featured image from Dall-E, CryptoQuant.com, chart from TradingView.com


 Dutch
Dutch English
 French
 German
 Greek
Greek Italian
 Portuguese
 Russian
 Spanish